The question a pass rate cannot answer
Most prop firms track a pass rate, some publish it, and a low one is read as evidence the filter works. That reading is half right, and the half it misses is expensive.
A low pass rate is consistent with two stories. In the first, the evaluation is catching traders who cannot hold a plan under pressure, which is what it exists to do. In the second, the evaluation's own design is producing some of the behaviour it then catches. Nothing in a pass rate separates them. The number is the same in both.
Start by conceding the obvious. A firm needs a filter. Funding a trader who blows up in month two costs more than the fee, and the firm's incentive to filter well is real. Every survivor is worth more than every failure, and a firm that graduates traders into real capital cannot graduate one who did not survive the evaluation. The open question is what else the filter is measuring alongside the trader.
Two conditions, measured
In 2004 Sally Dickerson and Margaret Kemeny reviewed 208 laboratory studies of acute psychological stress. Most of the studies had put people through a task, a speech, a mental-arithmetic test, a cognitive puzzle, and measured cortisol, the slower of the two stress hormones, before and after. The question was which features of a task reliably moved it.
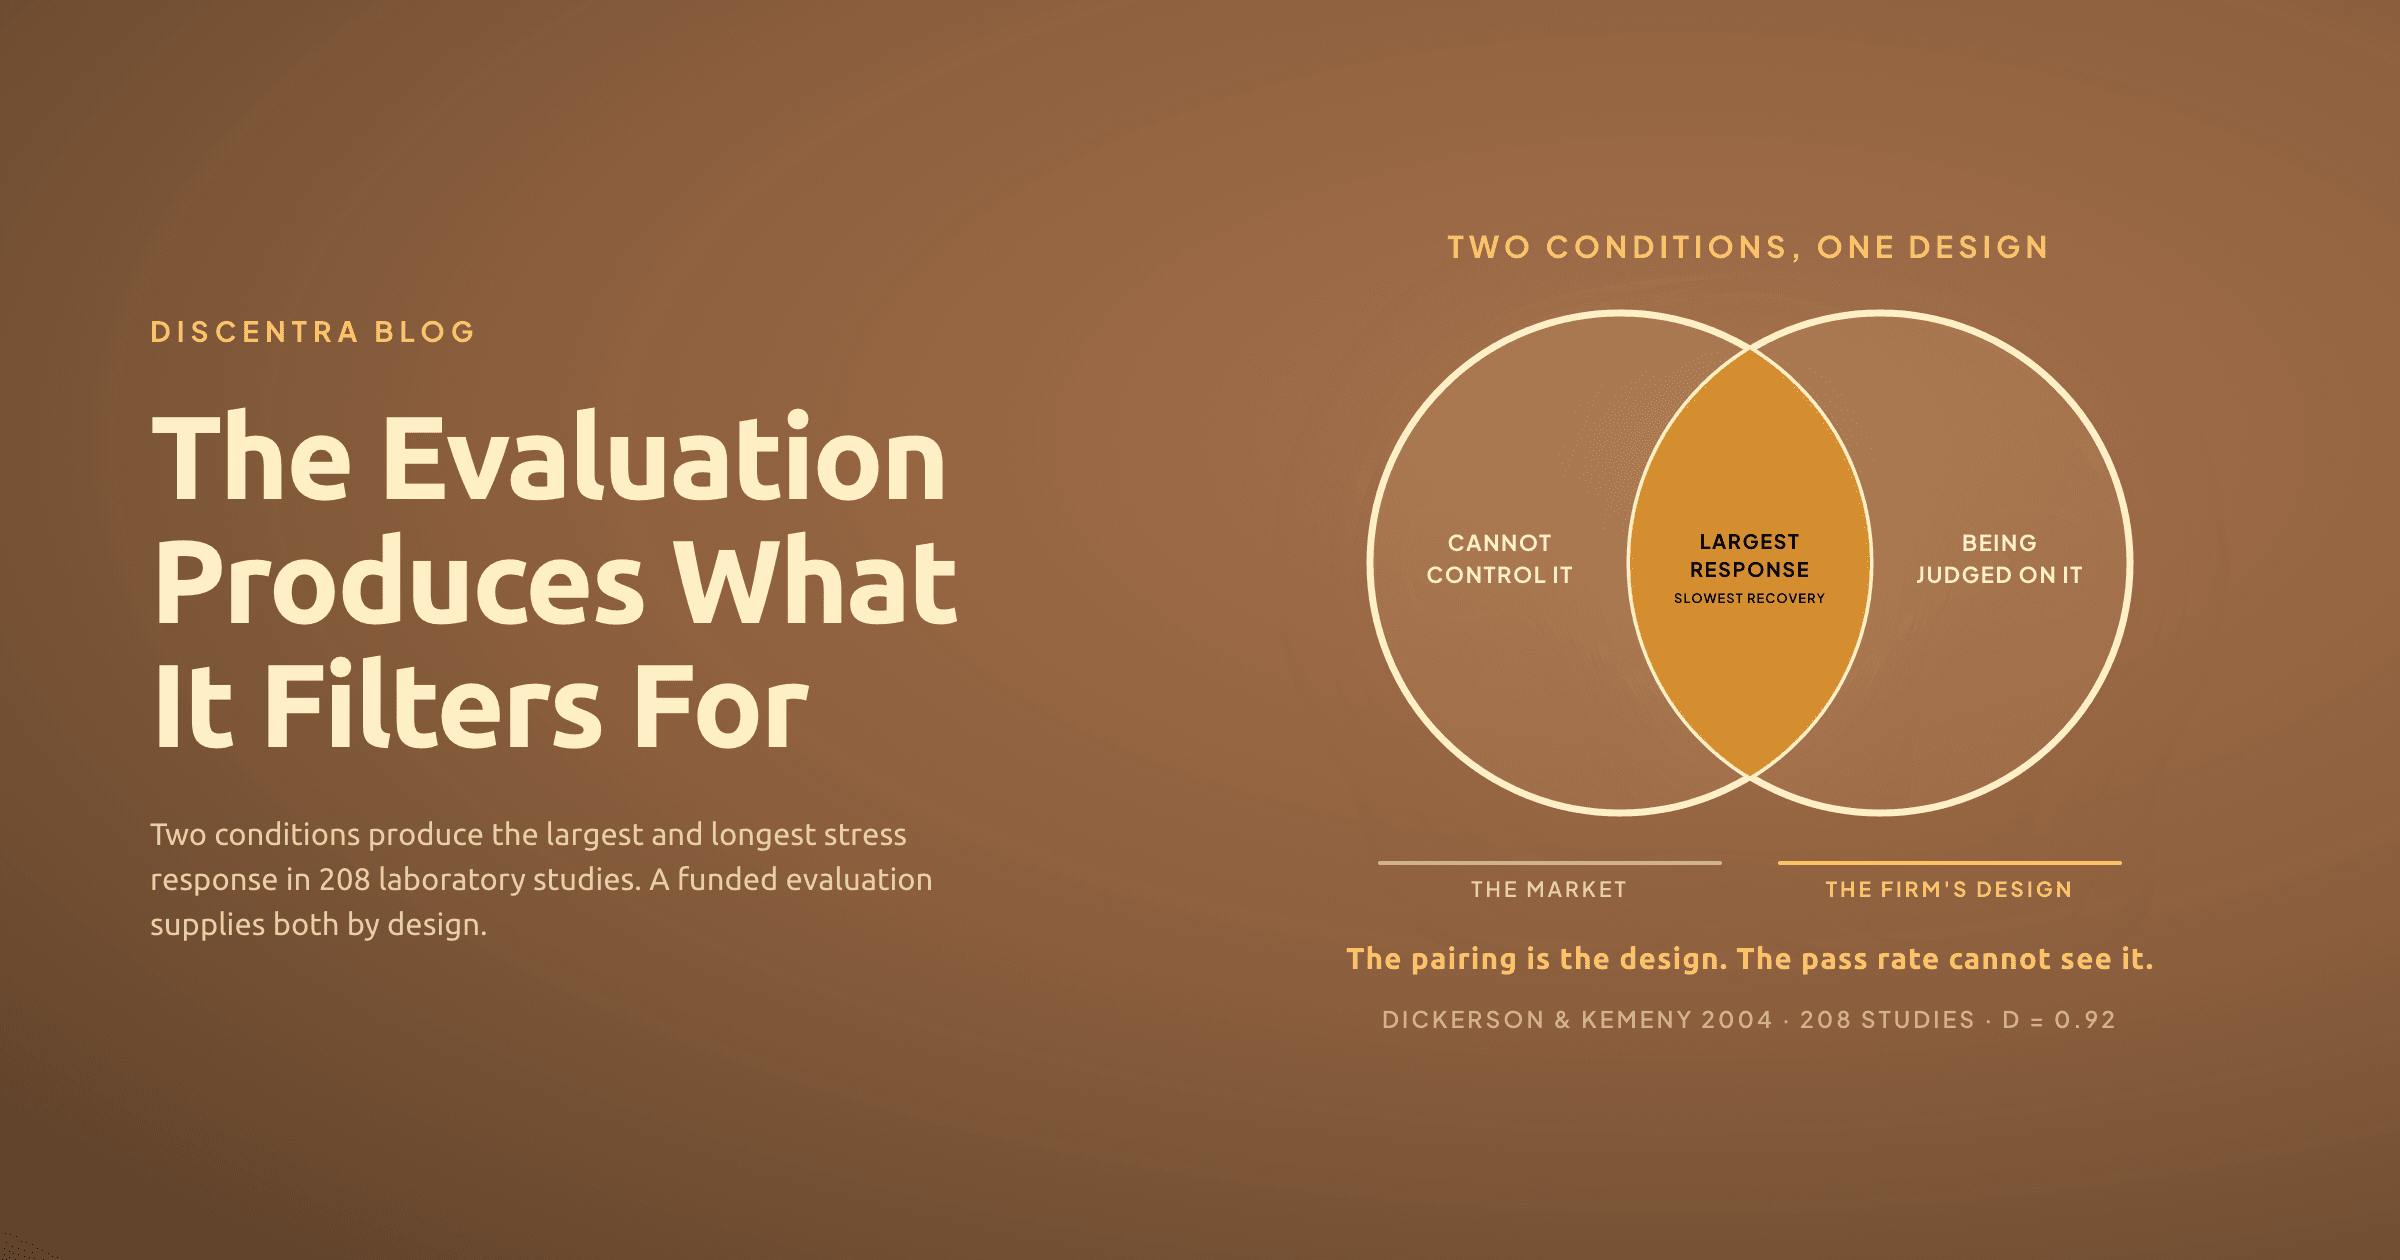
Two did. The first was uncontrollability: a task where nothing the person did could change the outcome. On its own it produced a small but reliable response. The second was social-evaluative threat, which the review defines as a task where performance could be negatively judged by others, and operationalises as being recorded, performing in front of an evaluative audience, or having someone present who offers a negative comparison. Tasks with that feature produced a response more than four times the size of tasks without it, by our arithmetic on the reported figures.
Then the two together. Tasks that combined an uncontrollable outcome with being judged produced the largest effect in the entire review, roughly three times the size of tasks with either feature alone, and large by the ordinary statistical standard. The review's abstract puts it in one sentence: "Tasks containing both uncontrollable and social-evaluative elements were associated with the largest cortisol and adrenocorticotropin hormone changes and the longest times to recovery."
The recovery finding matters as much as the size. Across the whole review, the peak came 21 to 40 minutes after the task began. By 41 to 60 minutes after the task ended, every other kind of task had returned to baseline. The tasks with both conditions had not. They were the only type still elevated an hour on.
Be precise about what the review measured: a hormone, in a laboratory, in healthy volunteers, after tasks that lasted minutes. It measured no trades, no decisions and no traders, and it says nothing about markets. What it establishes is which conditions move the stress axis most and hold it there longest. The transfer to an evaluation is this post's argument, and it is labelled as one.
What the evaluation supplies
Now read a funded evaluation against those two conditions.
Uncontrollability first. Once a position is open, the trader's control over the outcome is the market's control. The daily loss limit is a line the trader watches approach without being able to move it. The calendar runs whether the setups arrive or not, and a profit target with a deadline turns waiting into a cost. Every trader in every market lives with the first condition. The market supplies it, and no rule design removes it.
The second condition is the firm's addition. In the review, social-evaluative threat is present when the performance is recorded, when an audience is evaluating it, or when a negative comparison is in the room. An evaluation is a recording by definition. The equity curve is the permanent record. The dashboard is the audience, updated with every tick, and the firm reads it because reading it is the firm's job. Where a leaderboard exists, the negative comparison is built in and on by default. This describes what an evaluation is, matched against what the review says produces the largest and slowest-recovering stress response it found, and it accuses nobody of anything.
The market gives every trader the first condition. The firm adds the second, and it does so by choice, because every element of it is a setting.
Why the personal-account trader fails the evaluation
Operators see a pattern they do not always name. A trader with a clean personal record fails a funded evaluation, or passes one and trades differently on the funded account, or passes on the third attempt trading a smaller size than on the first. The industry's own education pages concede the mechanism from the other side, describing the evaluation as a test of emotional control and of mental resilience under pressure. That is a description of the second condition, offered as a feature.
The trader and the strategy are the same; the conditions are not, so the discipline that held under one condition is being measured under two. The behaviour the filter exists to catch, tilt and the revenge trade, does not record which condition produced the stress behind it.
The claim here is narrower than a hormone placing a trade. The axis the review measured is the one that is elevated at the moment the trader is deciding, and the faster response, the one that arrives within seconds of a loss, gets to the decision before the plan does. That mechanism has its own post, on why discipline disappears under pressure. What this review adds is that the evaluation's design turns the dial on the slower axis up, and holds it there through the window in which the next trade is placed.
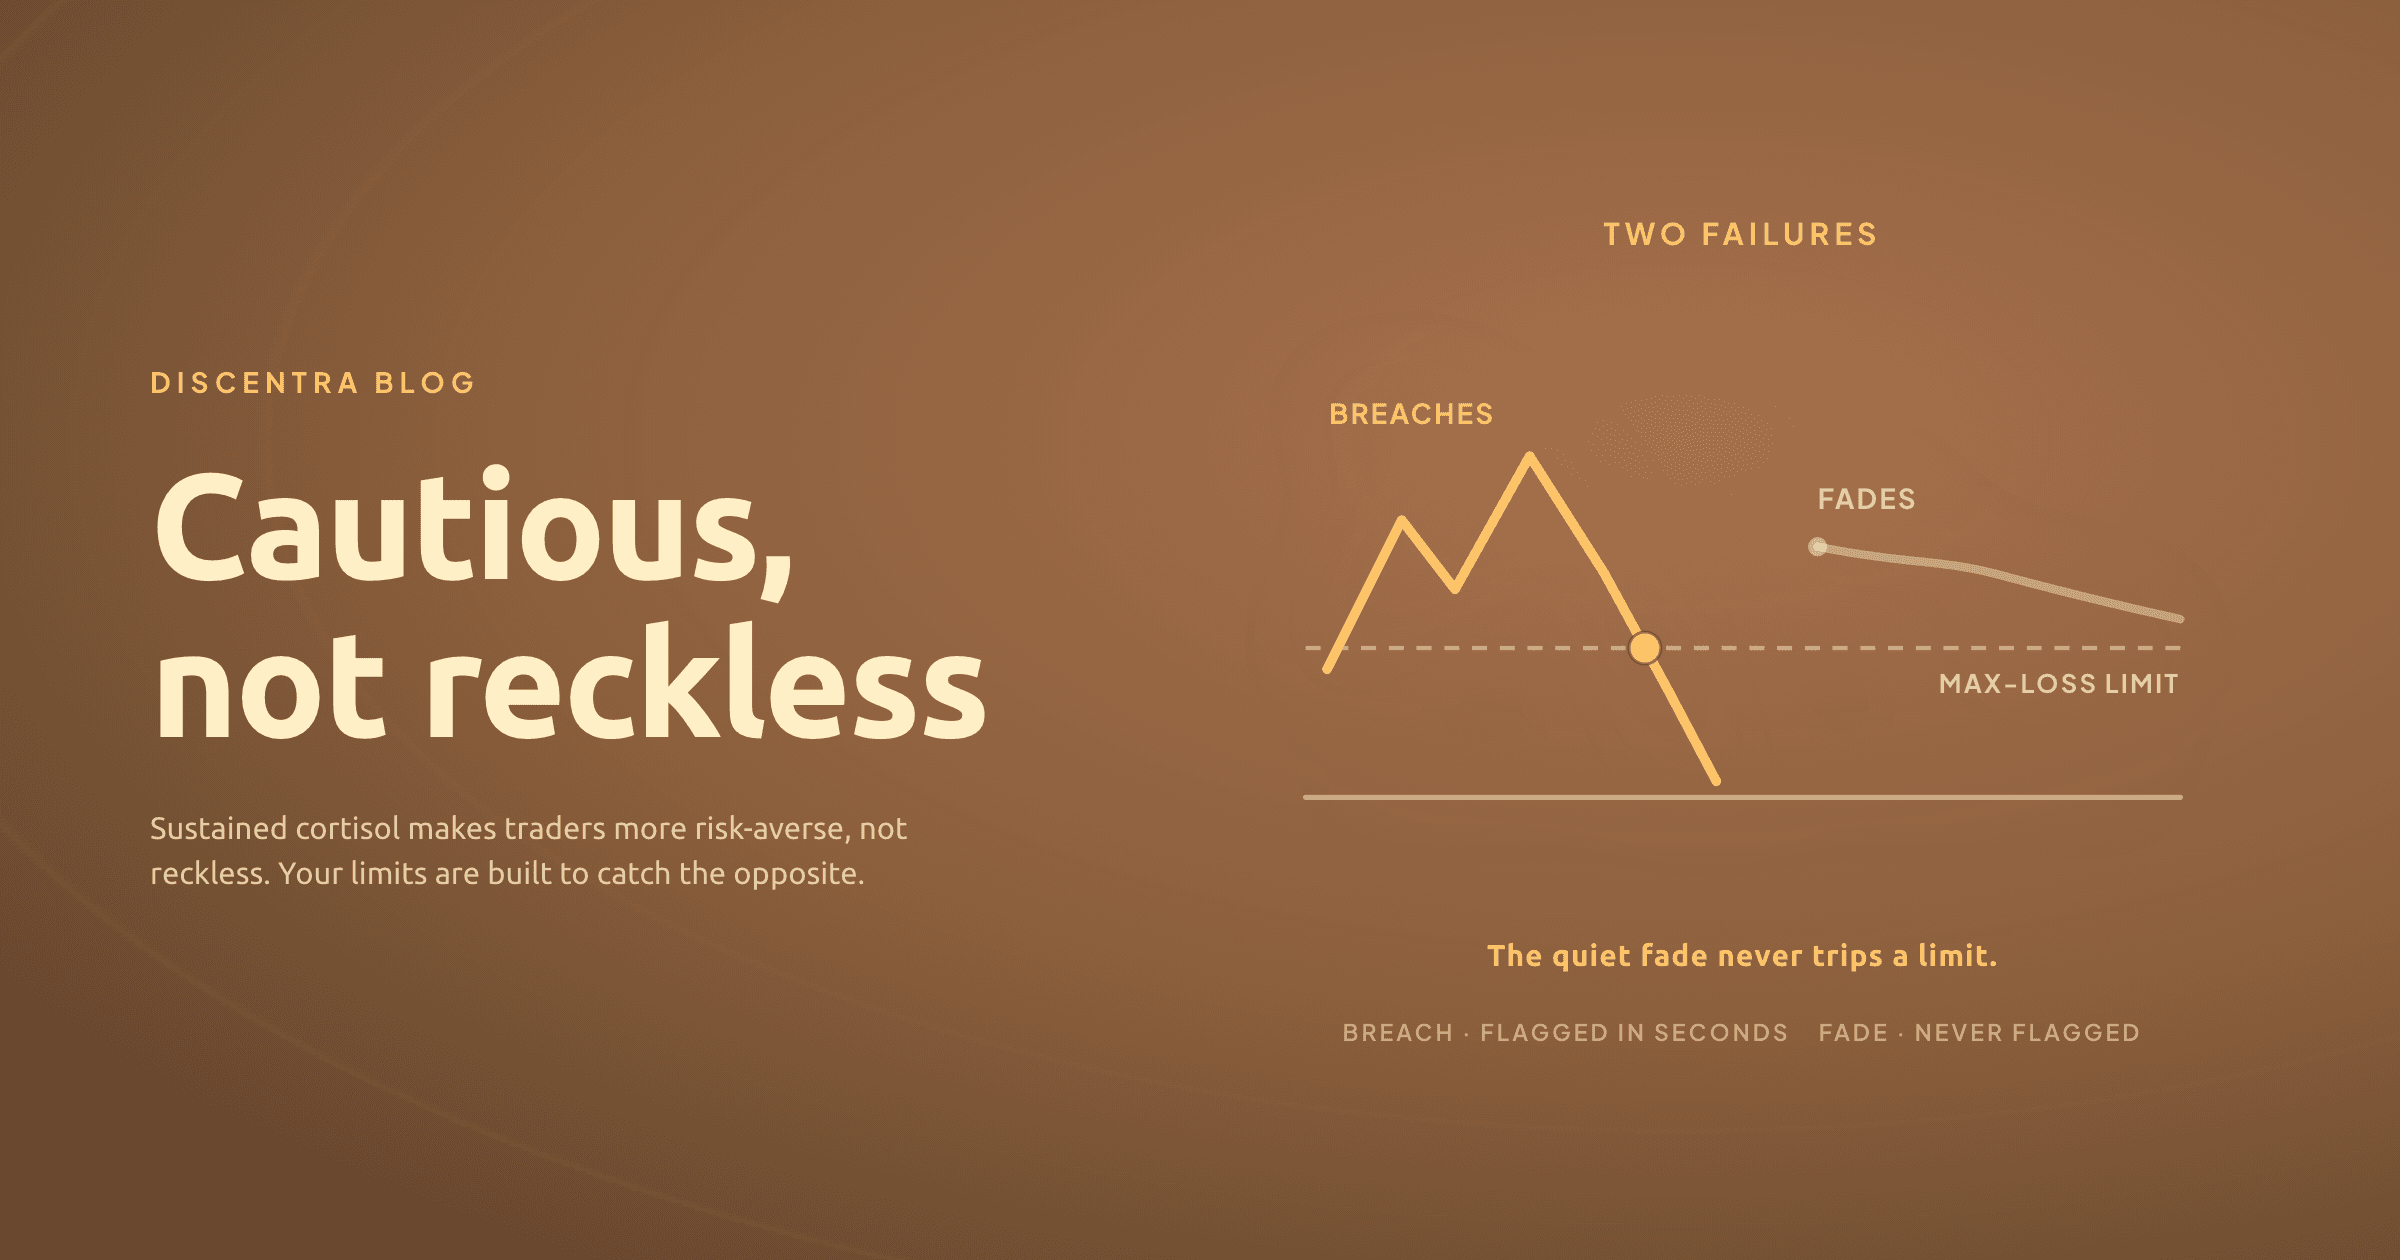
The slow burn is a different mechanism again. What sustained elevation over days does to a trader's risk appetite, and why the answer is caution rather than recklessness, is covered in the post on cortisol and risk-taking. That is a multi-day clock. This post is about the hour around a trade.
What a firm can change without weakening the filter
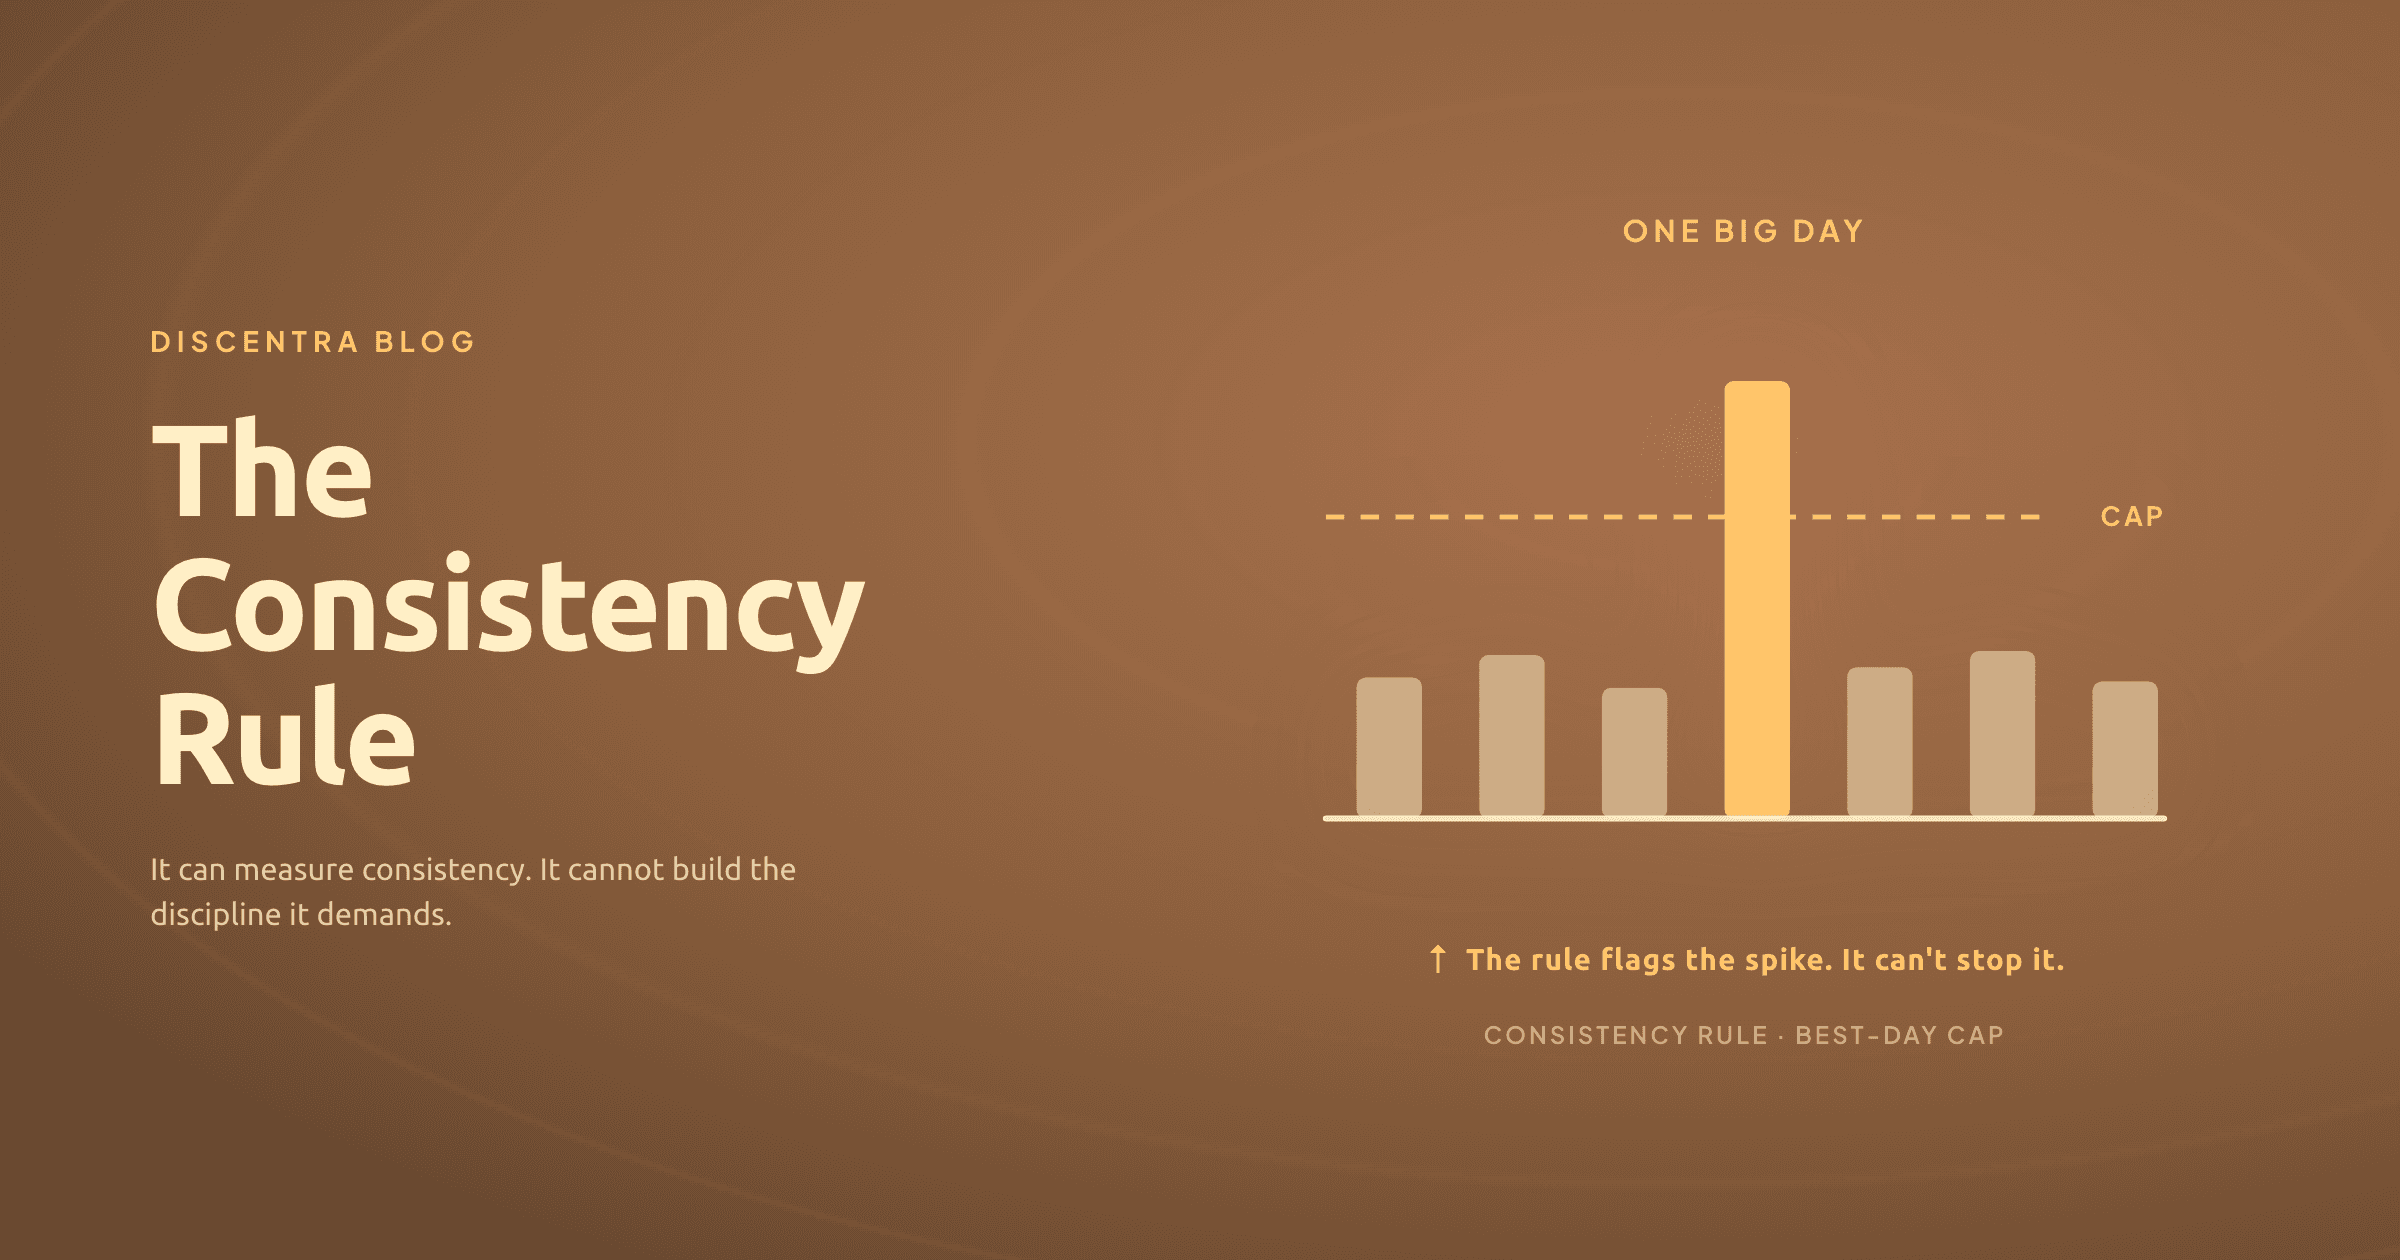
The uncontrollable half is the market and the rules that make an evaluation an evaluation. A drawdown limit is a drawdown limit. A firm that removed it would not have a filter. Nothing here argues for softer rules, and the consistency-rule post already made the case that a payout rule can measure discipline without building it.
The social-evaluative half is a set of choices, and each of them can be examined without touching a single rule.
- The dashboard's cadence. A live equity curve refreshed every tick is an audience that never blinks; a record that updates at session close is still a record.
- The leaderboard's default. A negative comparison is one of the three ways the review operationalises the second condition, and it is the easiest of the three to switch off.
- The framing of the equity curve, as a judgement in progress or as a record kept. The same number presented as a score is a different stimulus from the same number presented as a log.
- Whatever reaches the trader inside the window. The peak in the review came 21 to 40 minutes after the task began, and the two-condition tasks were the ones still elevated an hour later. In the standard design, the only thing that reaches the trader in that window is the number itself.
Firms already hold the data that would show what happened before the breach; the payout-review post covers what the same data reads like when it is read earlier. What an intervention built to reach a trader before the next trade says inside the window, and why it never says stop, is its own post.
None of these changes the filter's rules. They change how much of the second condition the firm adds on top of the first.
A pass rate is not a reading of the traders. It is a reading of the traders and the design together, and the firm only controls one of those.
Sources and notes
- The meta-analysis (208 laboratory studies; tasks combining uncontrollability and social-evaluative threat produced the largest cortisol effect in the review, d = 0.92, described by the authors as a very large effect; tasks with social-evaluative threat d = 0.67 against d = 0.15 without it; uncontrollable motivated performance tasks without social-evaluative threat d = 0.32; peak cortisol response 21 to 40 minutes from stressor onset; cortisol returned to prestressor levels by 41 to 60 minutes after the end of the stressor overall, and the tasks with both conditions were the only type still elevated in that interval, d = 0.28): Dickerson, S. S. and Kemeny, M. E., "Acute Stressors and Cortisol Responses: A Theoretical Integration and Synthesis of Laboratory Research", Psychological Bulletin 130(3), 2004, pp. 355 to 391 (DOI 10.1037/0033-2909.130.3.355). Peer-reviewed meta-analysis. Scope: laboratory stressors lasting minutes, healthy volunteers, hormone outcomes; not traders, not trades, not decisions. The "roughly three times" comparison is the authors' own, in both the main analysis (the combination was almost 3 times that of the components separately) and the post-stressor analysis (nearly 3 times tasks with either component alone); "more than four times" is Discentra's arithmetic on the reported 0.67 against 0.15, not the authors' words. The peak figure is the pooled result across all 208 studies; the figure this review reports is 21 to 40 minutes from onset.
- The transfer to an evaluation (mapping the drawdown limit and the clock onto uncontrollability, and the equity record, dashboard and leaderboard onto the review's three operationalisations of social-evaluative threat): Discentra's own argument, labelled as such above. No study has measured cortisol in traders during a funded evaluation.
- The industry's own framing (the evaluation as a test of emotional control and of mental resilience under pressure): stated on the trader-education pages of several prop firms, read 18 September 2026. Category-level and descriptive; no firm is named and no figure is drawn from it.
- The fast stress response (adrenaline within seconds; the plan-writing part of the brain suppressed under acute stress): covered with its own sourcing in the linked post on the neuroscience of tilt.
- The slow-burn mechanism (sustained cortisol over eight days and risk aversion): covered with its own sourcing and scope in the linked post on cortisol and risk-taking. It is a multi-day effect and is not used here to explain behaviour in the minutes after a loss.
- Pass rates: no figure is cited in this post because no published pass rate has a verifiable primary source. The argument does not depend on the number.
- The design options (dashboard cadence, leaderboard default, equity framing, what reaches the trader inside the window): stated as observations about design, not as measured outcomes. No client data underlies this post.