Platforms track prices. They should track people.
Every trading platform generates data. Prices, volumes, positions, orders, fills, rejections. Granular, timestamped, stored for years. Risk management teams build dashboards around it. Compliance teams audit it. Product teams optimise the interface that displays it.
None of this data describes the trader.
The person behind the screen is where the risk lives. Behavioural risk: the probability that a trader abandons their own plan, makes an emotional decision, and damages their account in a way that leads to churn. ~75% of retail traders quit within 90 days. Some quit over the spreads. Others quit because of what happened between their ears during a losing session.
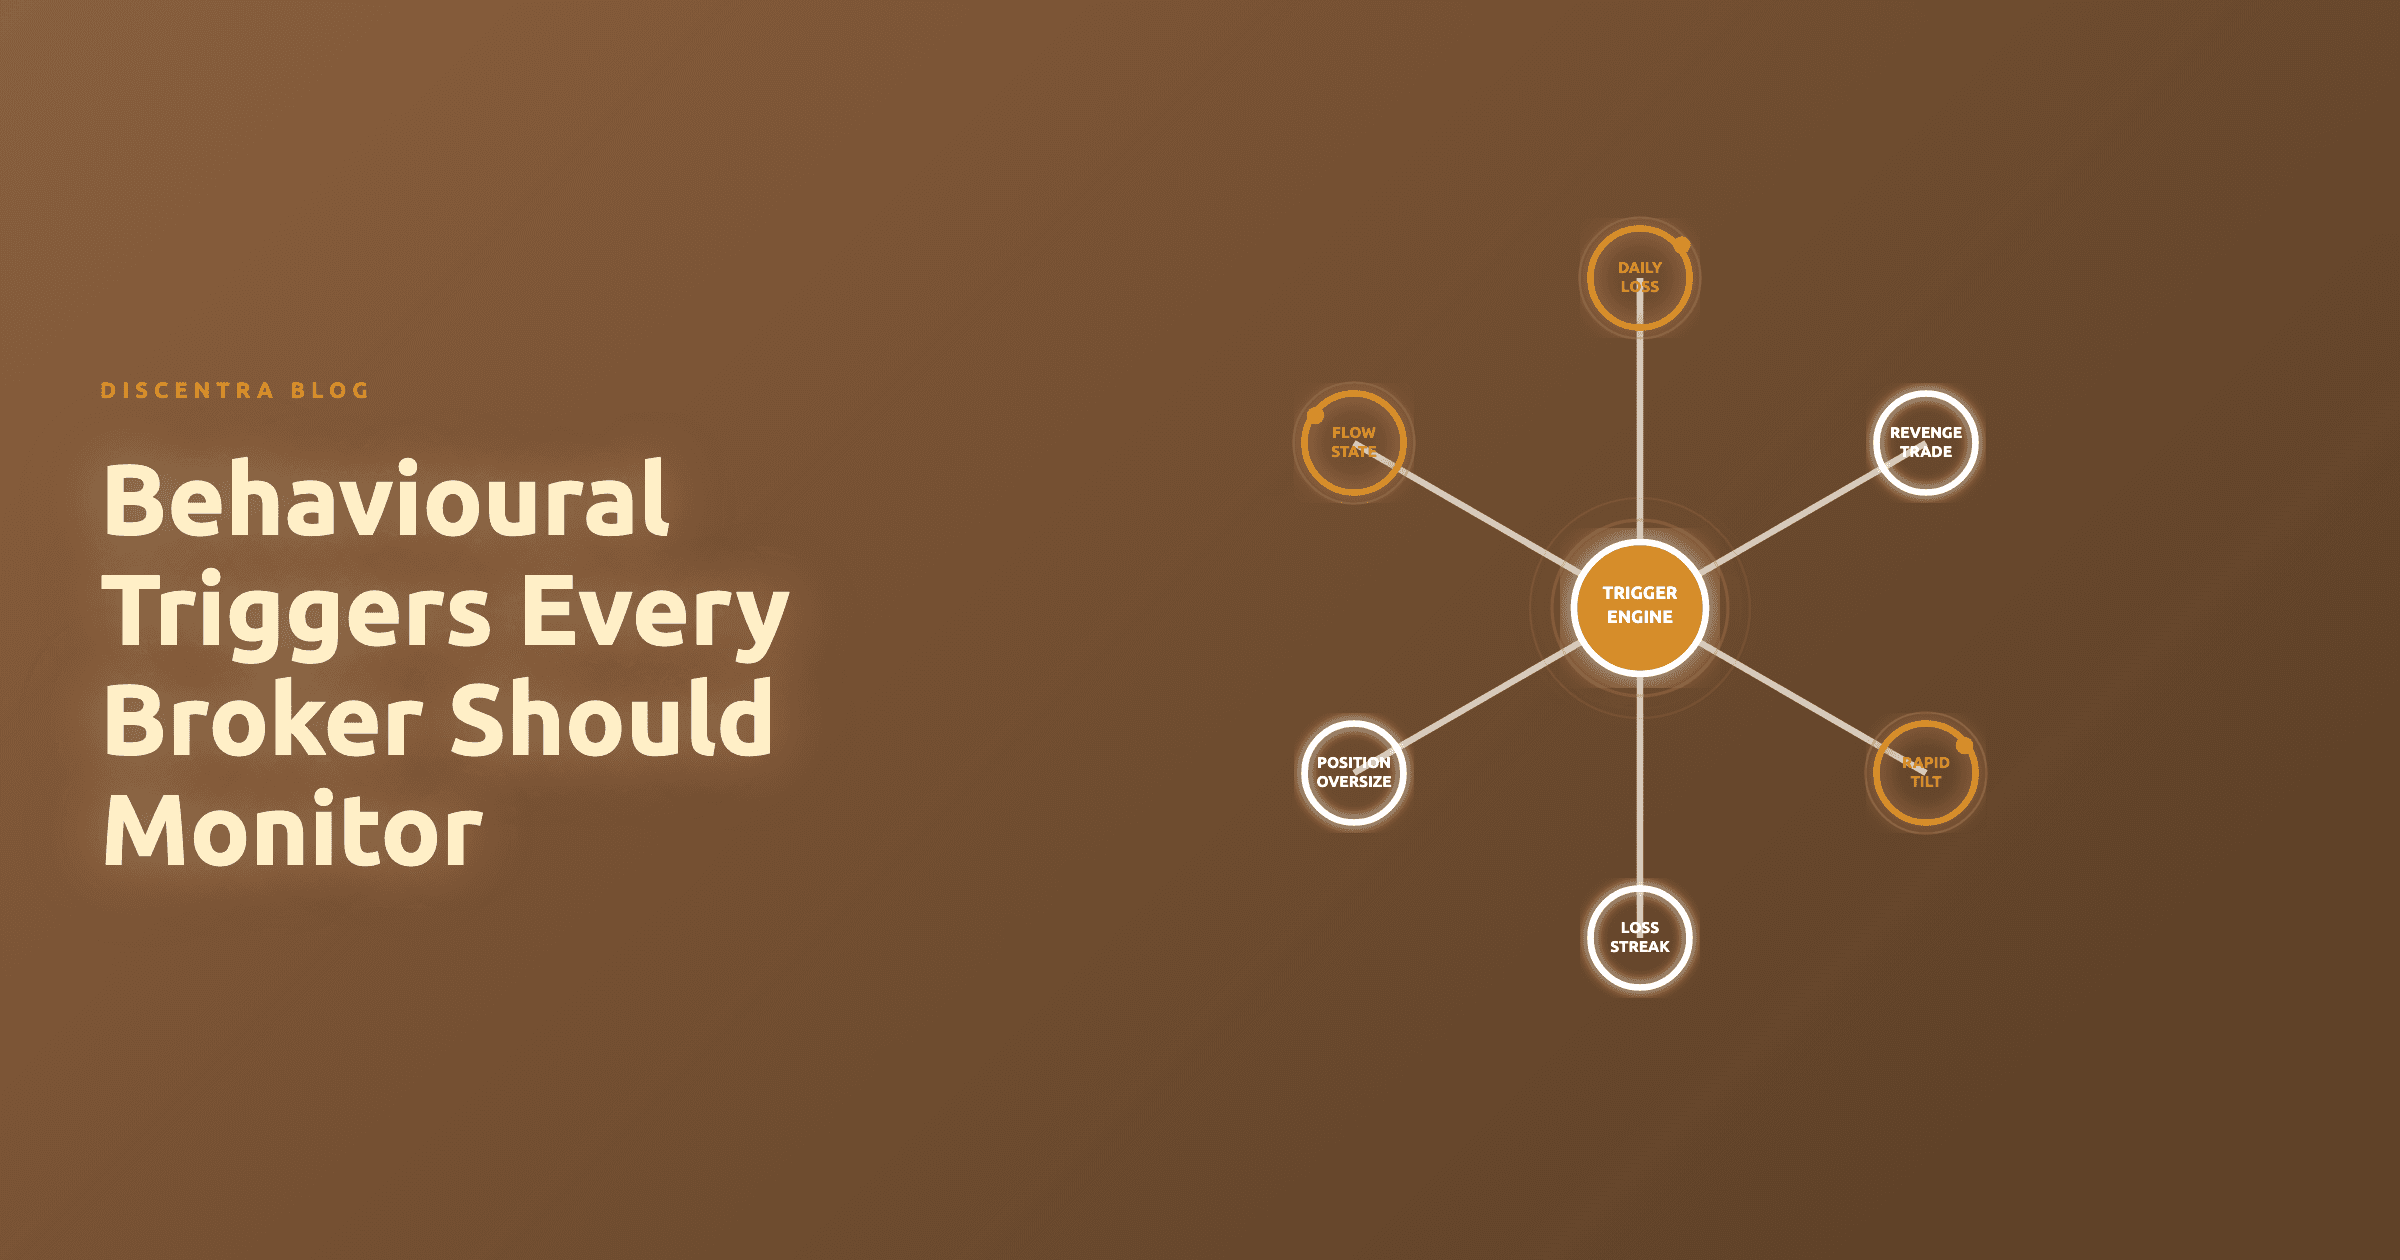
Six behavioural patterns are worth watching before an account blows up. Every one of them is detectable from data that brokers and prop firms collect today. The question is whether anyone reads it for behaviour.
Trigger 1: Daily loss limit approach
The trigger is not hitting the daily loss limit. The trigger is approaching it.
A trader who has used 80% or more of their daily loss limit is in a different position from one who is down 20%. The remaining buffer is thin, and one more loss can end the session or the account.
That creates a paradox. The rational response is to reduce risk, tighten stops, or stop trading. The emotional response: take one more trade to "get back to breakeven," and size it larger to get there faster. A flag at 80% arrives while a pause still leaves room in the day.
What to monitor
Track the session's cumulative P&L against the daily loss limit the firm has declared. Flag when a trader crosses 80% of it. A firm can also check, in its own records, how often the same trader has hit the limit in recent sessions.
A trader who repeats this pattern is not managing risk. They are running into the wall on a loop.
The intervention point is at 80%, not 100%. Once the limit is hit, the damage is done. The trader's session is over, and a flag at 100% arrives too late to change it.
Trigger 2: Revenge trade pattern
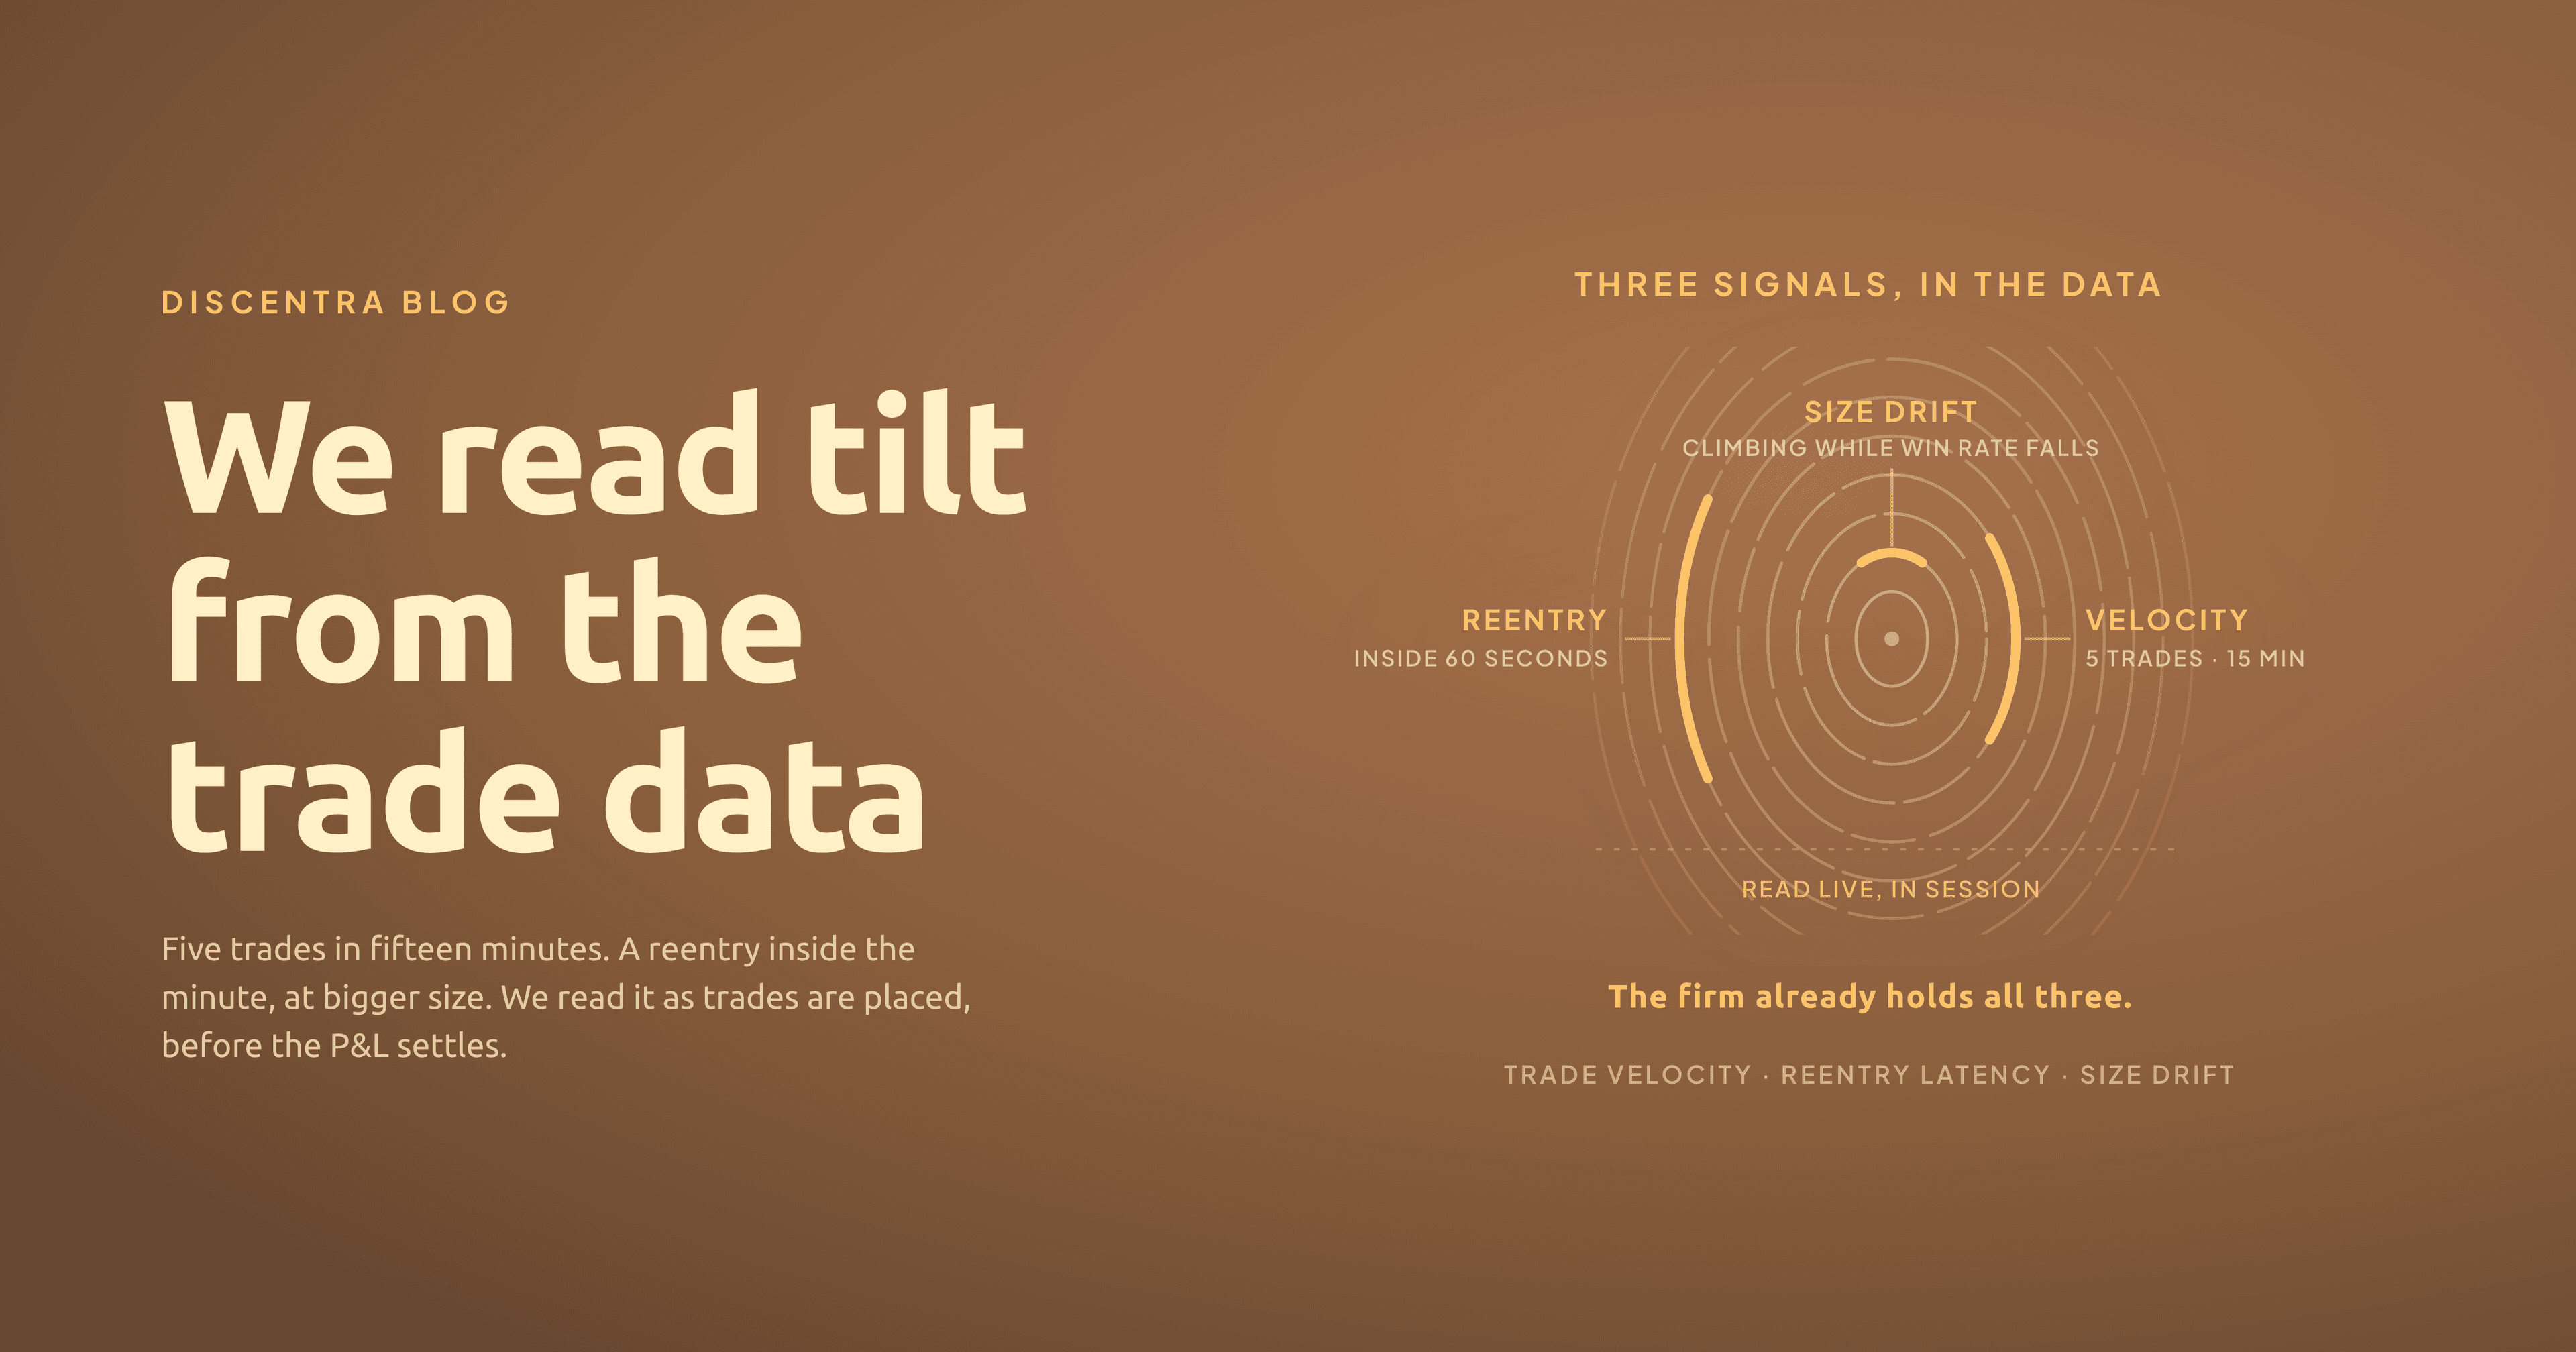
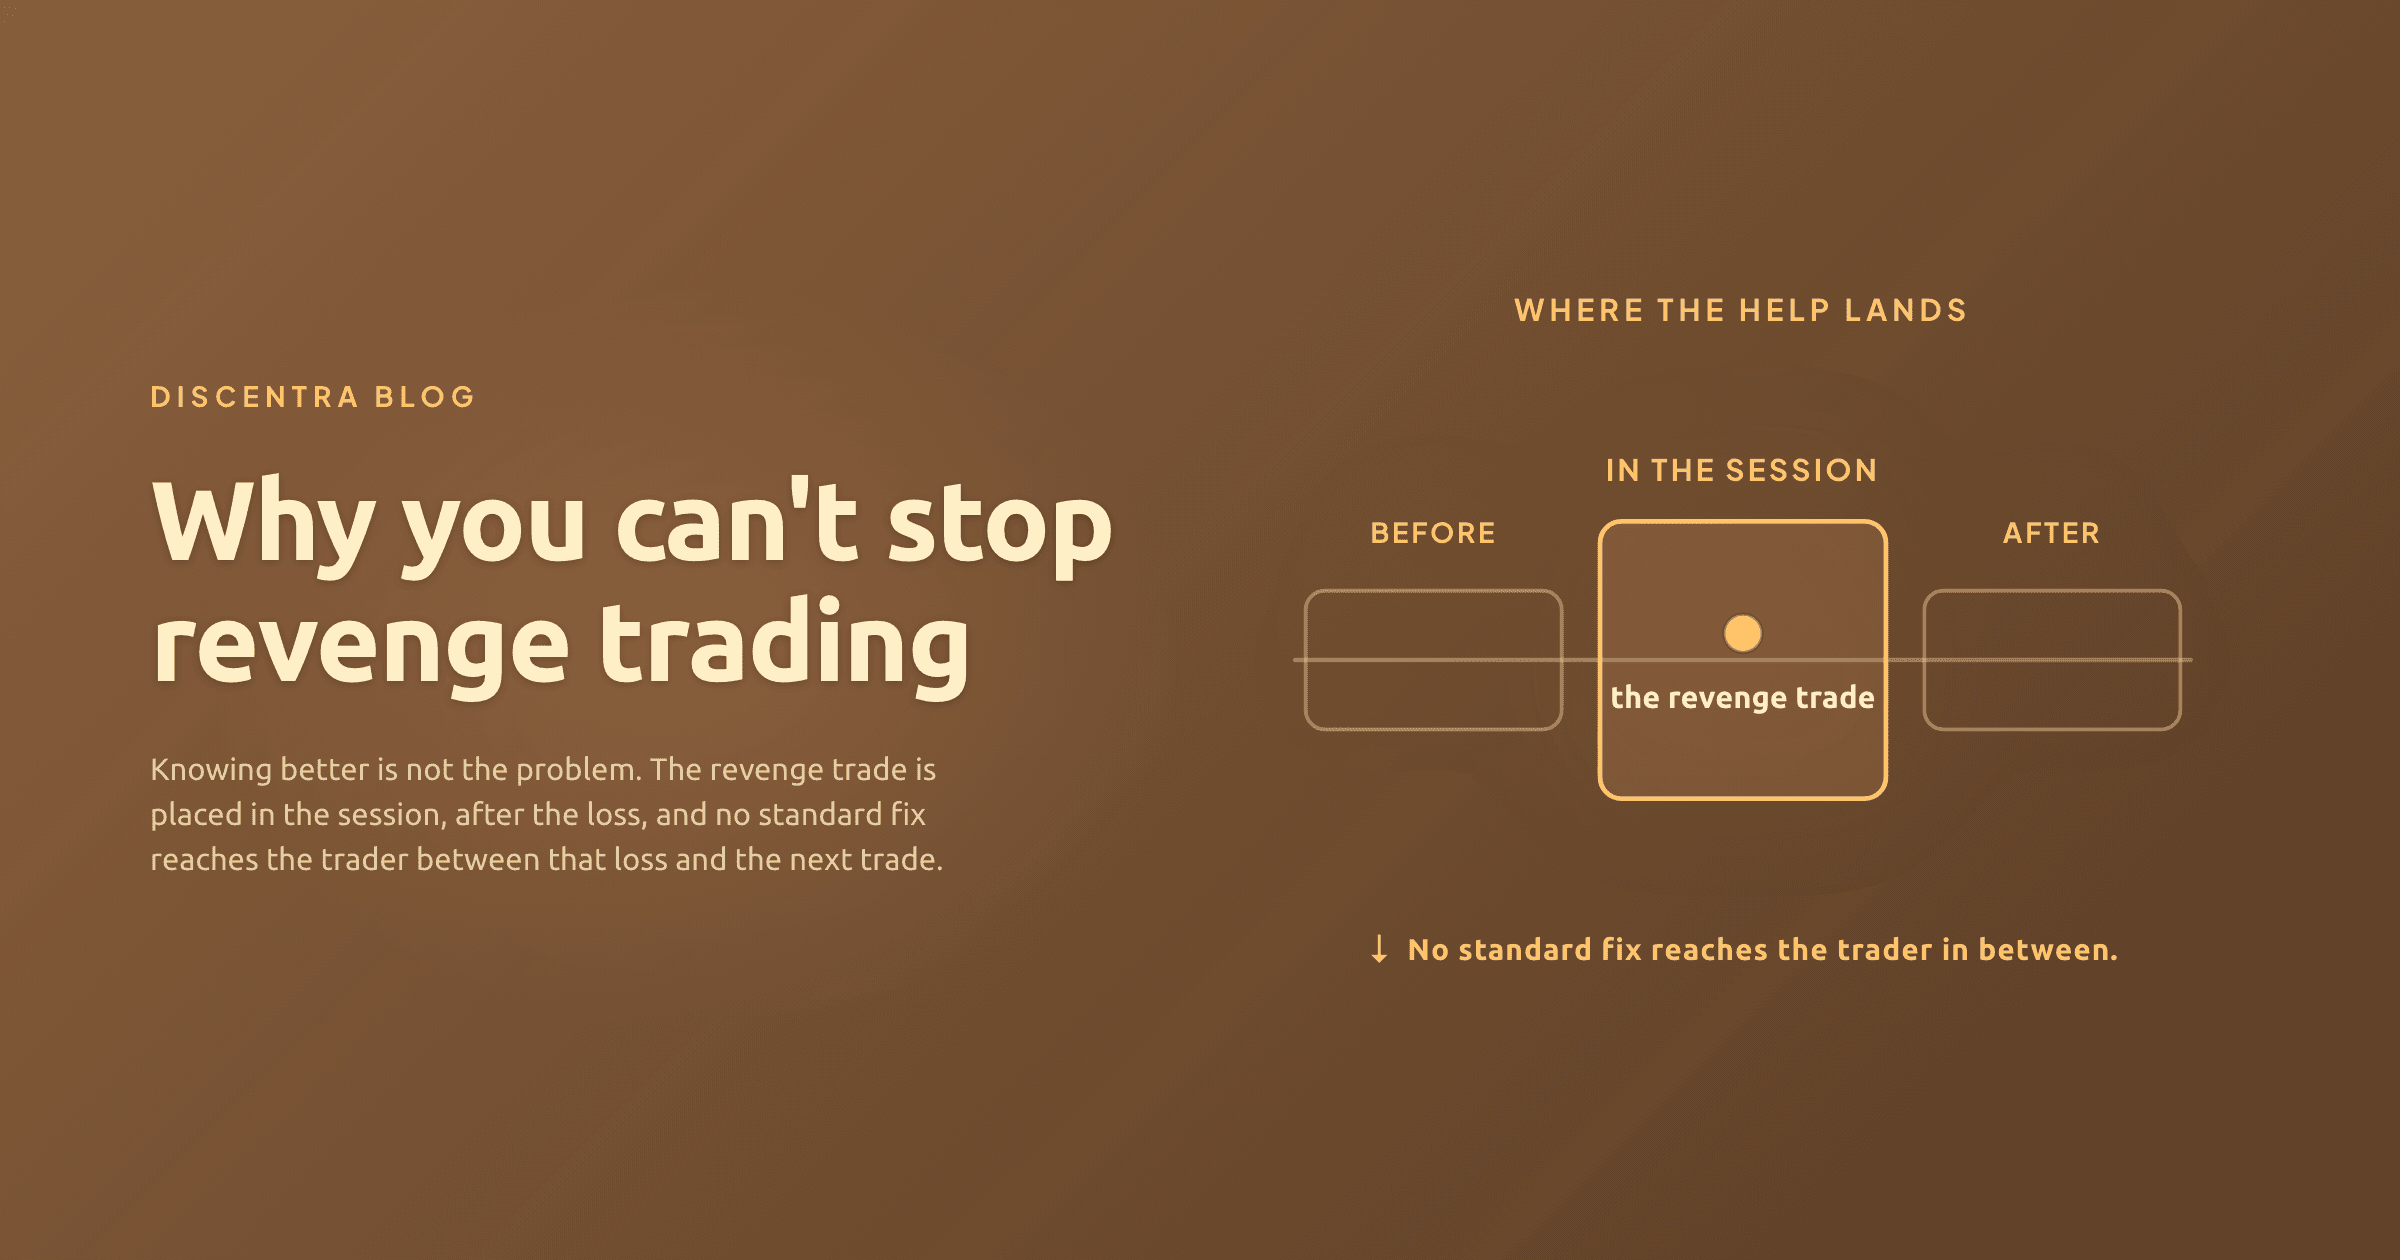
A loss closes. Within 60 seconds, the trader opens a new position in the same symbol, larger than the last. This is the revenge trade: an attempt to recover the loss in a single trade, driven by emotion rather than analysis.
The trader is not following a setup. They are following a feeling: "I need to win that back." The trade that follows skips the trader's own entry criteria.
What to monitor
Three conditions must be present at the same time:
- The previous trade closed at a loss
- A new trade opened in the same symbol within 60 seconds of the close
- The new position is larger than the losing one
A single instance is noteworthy. Two instances in the same session is a pattern. Three or more in a week marks a trader to watch closely.
The 60-second window is critical. A trader who waits 5 minutes, reviews their journal, and enters a new trade at normal size is following a process. A trader who re-enters in under a minute at larger size is reacting, not trading.
Trigger 3: Tilt sequence
Five or more trades in 15 minutes. It can be a sign of tilt: the state where a trader abandons strategy and trades on impulse, clicking into positions without analysis, hoping activity replaces the discipline they have lost.
Tilt looks different from high-frequency scalping. A scalper who takes 20 trades per hour does it with stable position sizes and a defined edge. A trader in tilt does it with erratic sizes and a falling win rate.
What to monitor
Count the trades opened in any rolling 15-minute window and flag five or more. A count on its own cannot tell tilt from a scalping strategy, so read the flag beside what else moved in that window: the sizes, and the results.
Tilt sequences can escalate: a first burst of rapid trades, then another, faster and less selective, with each round adding pressure to keep going.
Trigger 4: Five consecutive losses
Five losses in a row. Regardless of size. Five losses of $10 in a row can weigh on a trader more than a single loss of $200.
The dollar amount is higher in the single loss. We count the run anyway, because each loss in it can confirm a story: "I cannot win today." "The market is against me." "My strategy is broken." By the fifth, a trader may be questioning the whole approach, not the setup in front of them.
What to monitor
Track consecutive loss streaks per trader. Flag at five. The flag should trigger an assessment of what happens next, not an immediate intervention. Some traders handle five consecutive losses well: they step away, reduce size, or stop for the day.
The signs to watch for come next: a re-entry within seconds, a larger size, or a switch to an unfamiliar instrument. The streak is the warning. The response to the streak determines the severity.
Combine this trigger with the revenge trade indicator. Five consecutive losses followed by a sub-60-second re-entry at larger size is the combination to act on first.
Trigger 5: Position size overload
Picture a trader who has traded 1 lot all month. Today's trade is 4 lots, over the maximum the firm has declared for that symbol. No new strategy was loaded. No account size change justifies it. The trader has quadrupled their risk on a single trade.
Position size overload is the behavioural equivalent of raising your voice. The trader is making a point, not a trade. The oversized position says: "This one will make up for everything." It does not.
What to monitor
Compare each trade's size with the maximum lot size the firm has declared for that symbol. Flag any trade above it. The threshold is the firm's own, and it can be set per symbol, because a lot carries different exposure in different instruments.
Context still matters when the flag is read. A trader who increases size over weeks as their account grows is scaling up. A trader who doubles size in a single trade after a losing session is compensating. A firm reviewing the flag can tell the two apart by trajectory: smooth scaling versus a sudden spike.
The downside is amplified by the same multiple. A 4x position that moves against the trader produces a 4x loss. If the trader was already near their daily loss limit (Trigger 1), the oversized trade can breach it in a single move.
The compounding effect
Position size overload can appear alongside the other triggers: after a losing streak (Trigger 4), with a revenge trade (Trigger 2), or near the daily limit (Trigger 1). The triggers are interconnected. A trader showing several at once needs a faster response than a trader showing one.
Trigger 6: Flow state disruption
Five consecutive wins. The trader is sharp. Entries are clean, sizing is consistent, holding times match the strategy. Then trade six arrives: the position is 3x normal size, over the maximum the firm has declared for that symbol, and it comes moments after the last one closed. The trader has shifted from disciplined execution to invincibility.
This trigger is easy to miss. Winning streaks feel good. Firms celebrate profitable traders. But oversizing after a winning streak deserves the same attention as revenge trading after losses, and a firm can check how the two compare in its own account data.
What to monitor
Track consecutive win streaks. At five consecutive wins, watch the size of the next trade against the maximum the firm has declared for that symbol. A trade above it straight after a winning run is a sign that "in the zone" may have become "overconfident."
We read this as Trigger 4 in reverse: a run of losses can wear confidence down, and a run of wins can inflate it. Either way, the size of the next trade is the thing to watch.
Why this matters for firms
Flow state disruption can turn a winning session into a losing one. An illustration: a trader is up $2,000, takes an oversized position, and gives the session's profit back in a single trade. Finishing down $500 after being up $2,000 can feel worse than being down $500 all day.
This is a trader worth a call: they can trade, and one position spoiled a winning day.
From detection to response: severity-based escalation
Detecting triggers is step one. Responding to them is the part designed to change what happens next. Different triggers warrant different responses, and different traders need different approaches.
A severity-based escalation framework matches the intervention to the risk level:
Tier 1, Watch:     Example trigger: approaching a
                   declared threshold.
                   Response: SMS nudge.
Tier 2, Warning:   Example trigger: reaching the
                   declared daily loss limit.
                   Response: SMS first, then a call if the
                   trader opens a new trade within 10
                   minutes.
Tier 3, Intervene: Example trigger: confirmed tilt or
                   revenge trading.
                   Response: immediate coaching call.
Tier 4, Crisis:    Example trigger: distress or financial
                   desperation in what the trader says.
                   Response: call plus handoff to the
                   firm's crisis escalation contact.
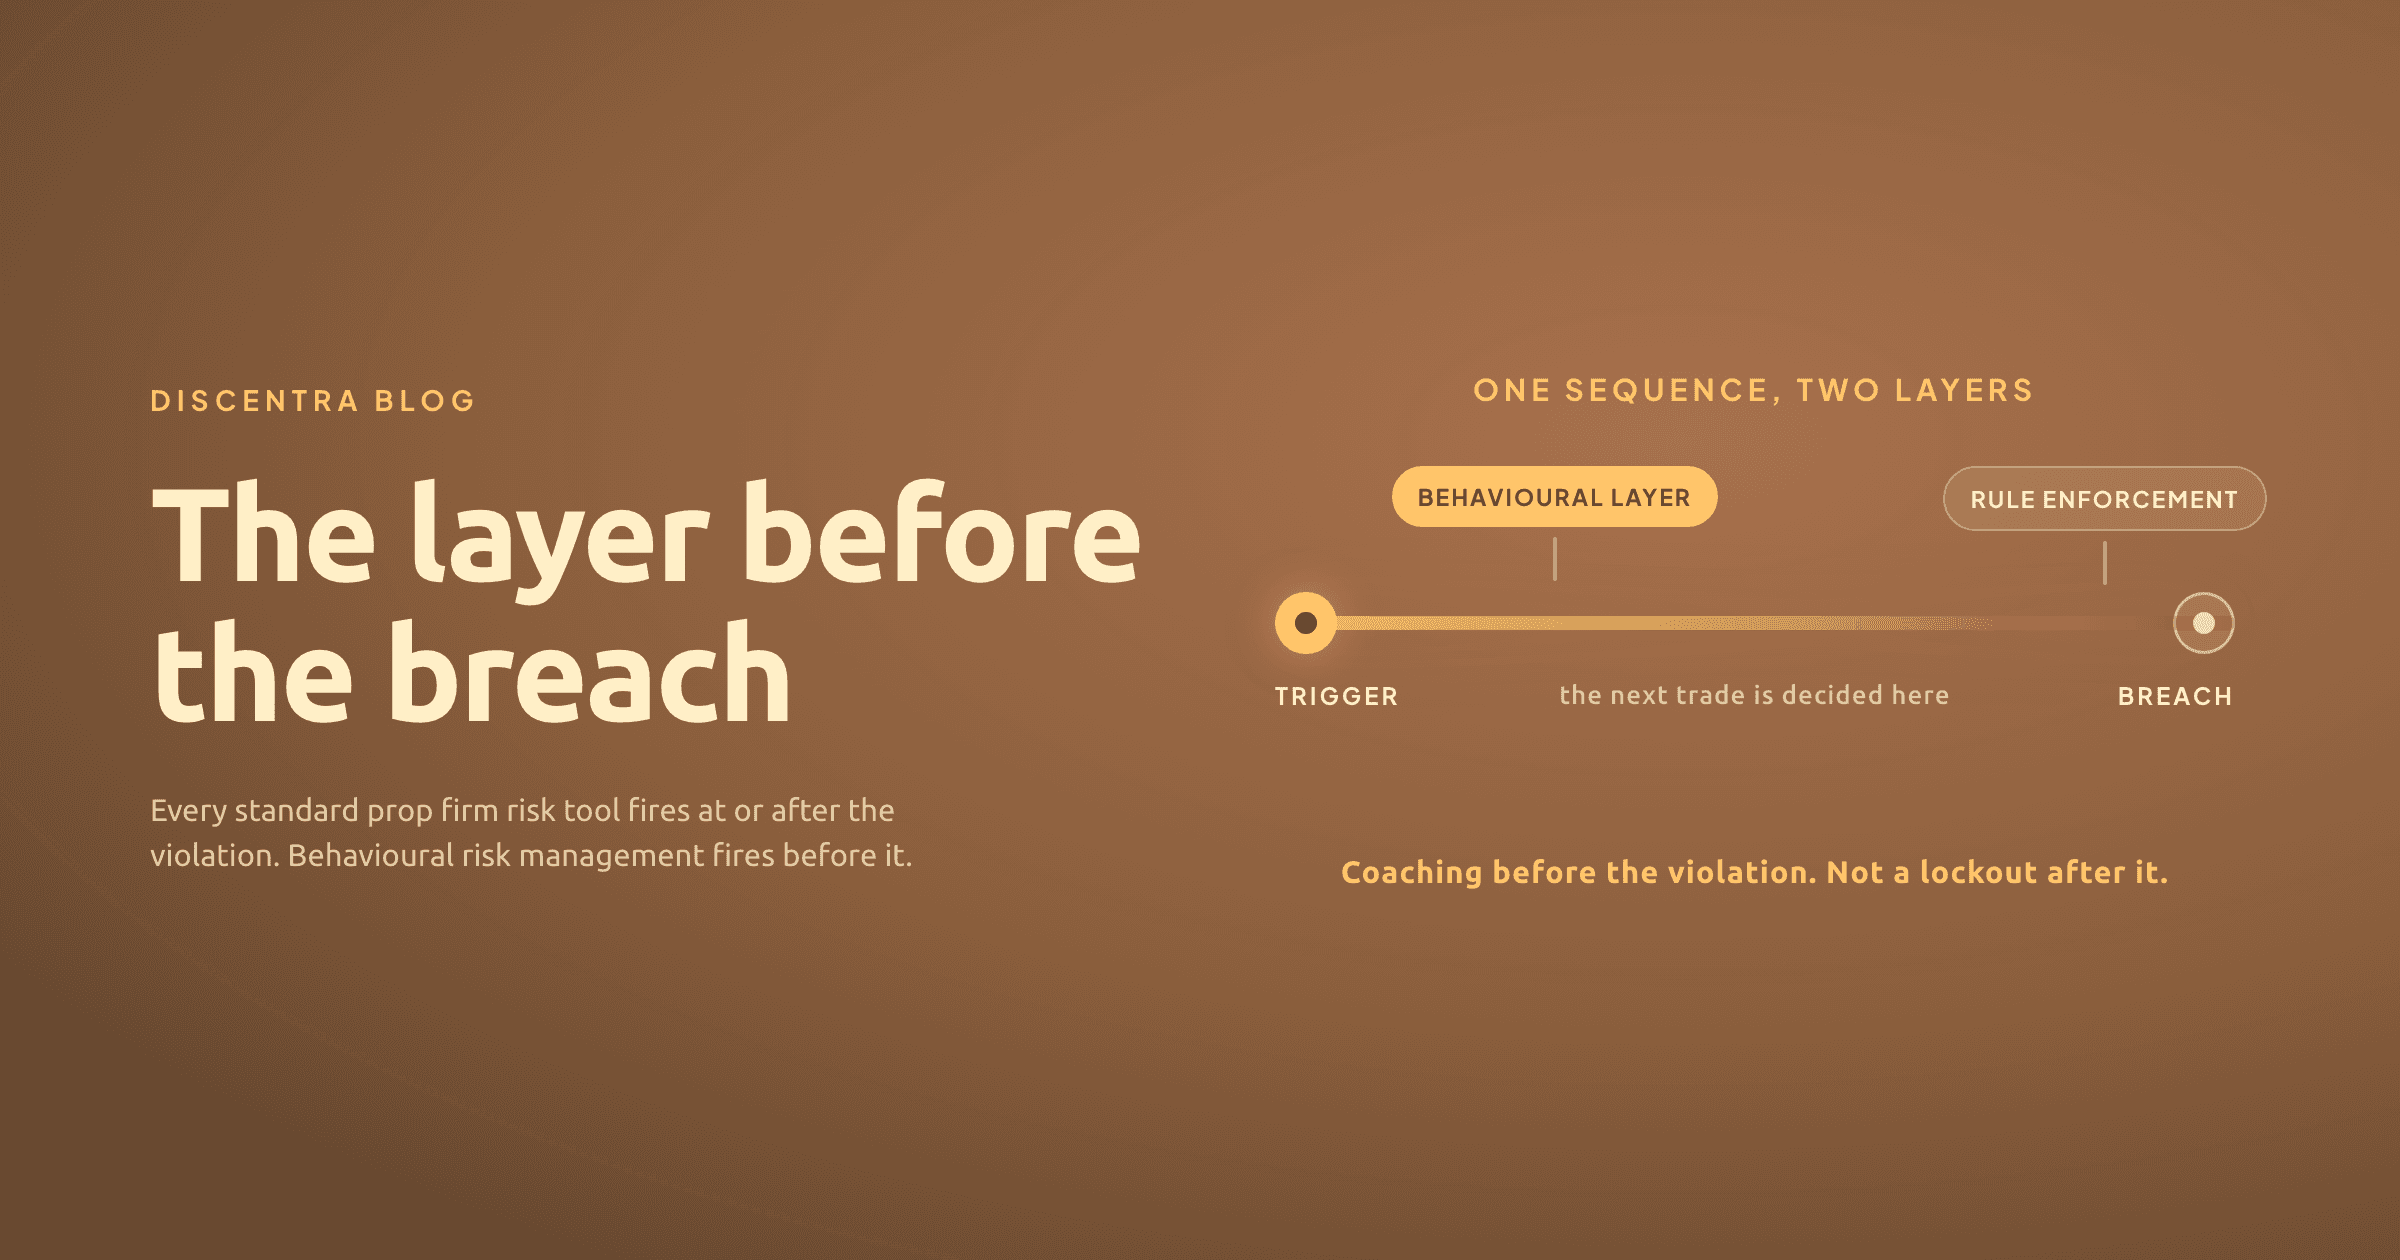
The key word in the framework is "real-time." A trigger that fires at 2pm and generates a report at 5pm misses the minutes between a trigger and the next trade. That is the window we design for, about 4 minutes on our working figure, which is an operational construct, not a measured one. A call that lands inside it is built to give the trader a pause before the next decision. An intervention that arrives the next day is a post-mortem.
The detection gap
Every data point in these six triggers exists in most trading platforms today. Timestamps, position sizes, P&L, trade frequency, win/loss sequences. Platforms collect it, store it, and expose it via API. A coaching layer needs seven of those fields, and refuses the price and the direction.
The gap is intent. Platforms use this data for risk management (did the trader breach a limit?) and compliance (did the trade follow the rules?). Behavioural monitoring asks a different question: is the trader about to make a decision they will regret?
The gap has an organisational half too. Ask a brokerage who owns reading these six patterns. Where it is nobody's job, the retention desk is cued by deposit events and trading behaviour sits outside every reporting line.
~75% of retail traders quit within 90 days. The patterns we watch for can be read from trade data, and we design around the minutes in which they show. Real-time coaching (coaching, not financial advice) is built to reach the trader while the pattern is still forming, not after the account has gone.
The data is there. The question is what you build on top of it.