You track churn rate. Do you track churn cost?
Your firm has a churn number. It lives in a dashboard somewhere, updated monthly, reported quarterly. "Our churn is 12%." "We're down to 9%." The percentage gets discussed, sometimes celebrated. What it costs is a different number.
Percentages hide money. A 10% churn rate at a firm with 10,000 traders and $500 average CAC is not the same as 10% at a firm with 500 traders and $100 CAC. The rate is identical. The damage is not.
The loss rates regulators publish are bleak. In 2018, before its own leverage limits took effect, ESMA published national regulators' analyses of retail CFD accounts across EU jurisdictions. (We keep the full set of sourced prop firm churn statistics on one page, with each figure labelled by evidence type.)
74-89% of retail accounts typically lose money on their investments, with average losses per client ranging from €1,600 to €29,000.
These are retail CFD accounts in 2018, before ESMA's own leverage limits: a loss rate, not a churn rate. Our reading is that a book where most accounts lose money has to keep being refilled. The economics of running a prop firm or retail broker are economics of replacement.
Below: what trader churn costs in dollars, not percentages. The visible costs, the hidden costs, and a worked example you can adapt to your own numbers.
The costs everyone sees
These are the line items that show up in a P&L or a marketing report. The ranges below are our own working assumptions, not published figures, and in our model these costs are the smaller part of the story.
Customer acquisition cost (CAC)
Our working range for acquiring each trader is $200 to $2,000, depending on segment and channel: our own market research, not a published figure. That includes paid ads, affiliate commissions, influencer deals, SEO content, and the sales team's time. When a trader churns, that spend is gone. Not reduced. Gone. It was spent before they left, so the worked example below leaves it out and counts the cost of replacing them instead.
Onboarding and provisioning
Account setup, platform access, KYC/AML checks, compliance documentation, welcome sequences, educational content delivery. For a prop firm, add evaluation processing and challenge infrastructure. We put these at $15 to $80 per trader, depending on how much is automated.
Compliance and KYC
Regulated brokers carry additional per-trader compliance costs: identity verification, screening against sanctions lists, ongoing monitoring obligations. We put these at $5 to $50 per trader.
Support during departure
Some churning traders leave noisily: they submit tickets, request refunds or dispute charges, and those tickets can take longer than average to close. We put the support cost per departing trader at $10 to $40.
Total visible cost per churned trader, on these assumptions: $230 to $2,170.
That number is painful. In our model it is also the smaller part.
The costs nobody tracks
The visible costs are sunk acquisition spend. The hidden costs are future revenue that never arrives.
Lost lifetime value
A trader who stays 12 months generates revenue through challenge fees, resets, data feeds, spread markup, or subscription fees depending on the model. Our working assumption, not a published figure, is an annual LTV of $1,200 to $3,500 per trader. When a trader churns at month two, the firm loses 10 months of revenue that was already in the forecast.
In the worked example below, lost LTV is the largest single component of churn cost, at almost twice the cost of acquiring replacements.
The retention math runs the other way too. Frederick Reichheld and Earl Sasser put a number on it.
Reducing defections by just 5% generated 85% more profits in one bank's branch system, 50% more in an insurance brokerage, and 30% more in an auto-service chain.
The spread is industry-dependent. The 85% comes from a single bank's branch system, with 50% in an insurance brokerage and 30% in an auto-service chain. The floor of that range is enough to redirect every retention budget worth running.
Negative reviews and brand damage
Traders talk. They post on Discord servers, Reddit threads, Twitter/X, Trustpilot, and YouTube. Some bad experiences end up in a public, searchable, permanent record, and in prop trading a buyer can read a firm's Trustpilot score before paying. We know of no published figure for how many prospects one negative review costs a prop firm, so the illustration below uses our own assumption.
As an illustration, on our own assumptions (a 3% review rate and 5 lost prospects per review, neither a published figure), a firm with 1,000 churned traders a month would get 30 negative reviews and 150 prospects who never sign up. At a $500 acquisition cost, that is $75,000 a month in phantom acquisition cost.
Refunds and chargebacks
On our own assumptions, not published figures, chargebacks hit 1% to 4% of departing traders, depending on the payment model and geography, and each costs $15 to $75 in processor fees and staff time, plus the refunded amount. At scale, payment processors can flag the account, and elevated chargeback rates can bring higher processing fees or account reviews.
The replacement treadmill
Every churned trader must be replaced to maintain revenue. In the same illustration, replacing 1,000 traders a month at a $500 acquisition cost means spending $500,000 a month on acquisition just to stand still. This is the treadmill that consumes marketing budgets and masks the true cost of retention failure.
The math: a worked example
Take a mid-size prop firm. These inputs are Discentra working assumptions, not audited industry figures (we know of none): the churn rate is our working estimate, the acquisition cost sits in our working range and the lifetime value is our working assumption.
- Active traders: 10,000
- Monthly churn rate: 10%
- Average CAC: $500
- Average annual LTV: $1,200 (or $100/month)
- Average trader tenure at churn: 2.5 months
- Remaining LTV lost per churned trader: $950 (9.5 months of revenue)
Every month, 1,000 traders leave. Here is the annual cost:
Churned traders per year:           12,000
Lost remaining LTV:                 12,000 × $950     = $11,400,000
Onboarding replacements:            12,000 × $40      = $480,000
Support/departure costs:            12,000 × $25      = $300,000
Negative review damage (est.):      12,000 × $30      = $360,000
Replacement acquisition cost:       12,000 × $500     = $6,000,000
─────────────────────────────────────────────────────────────────
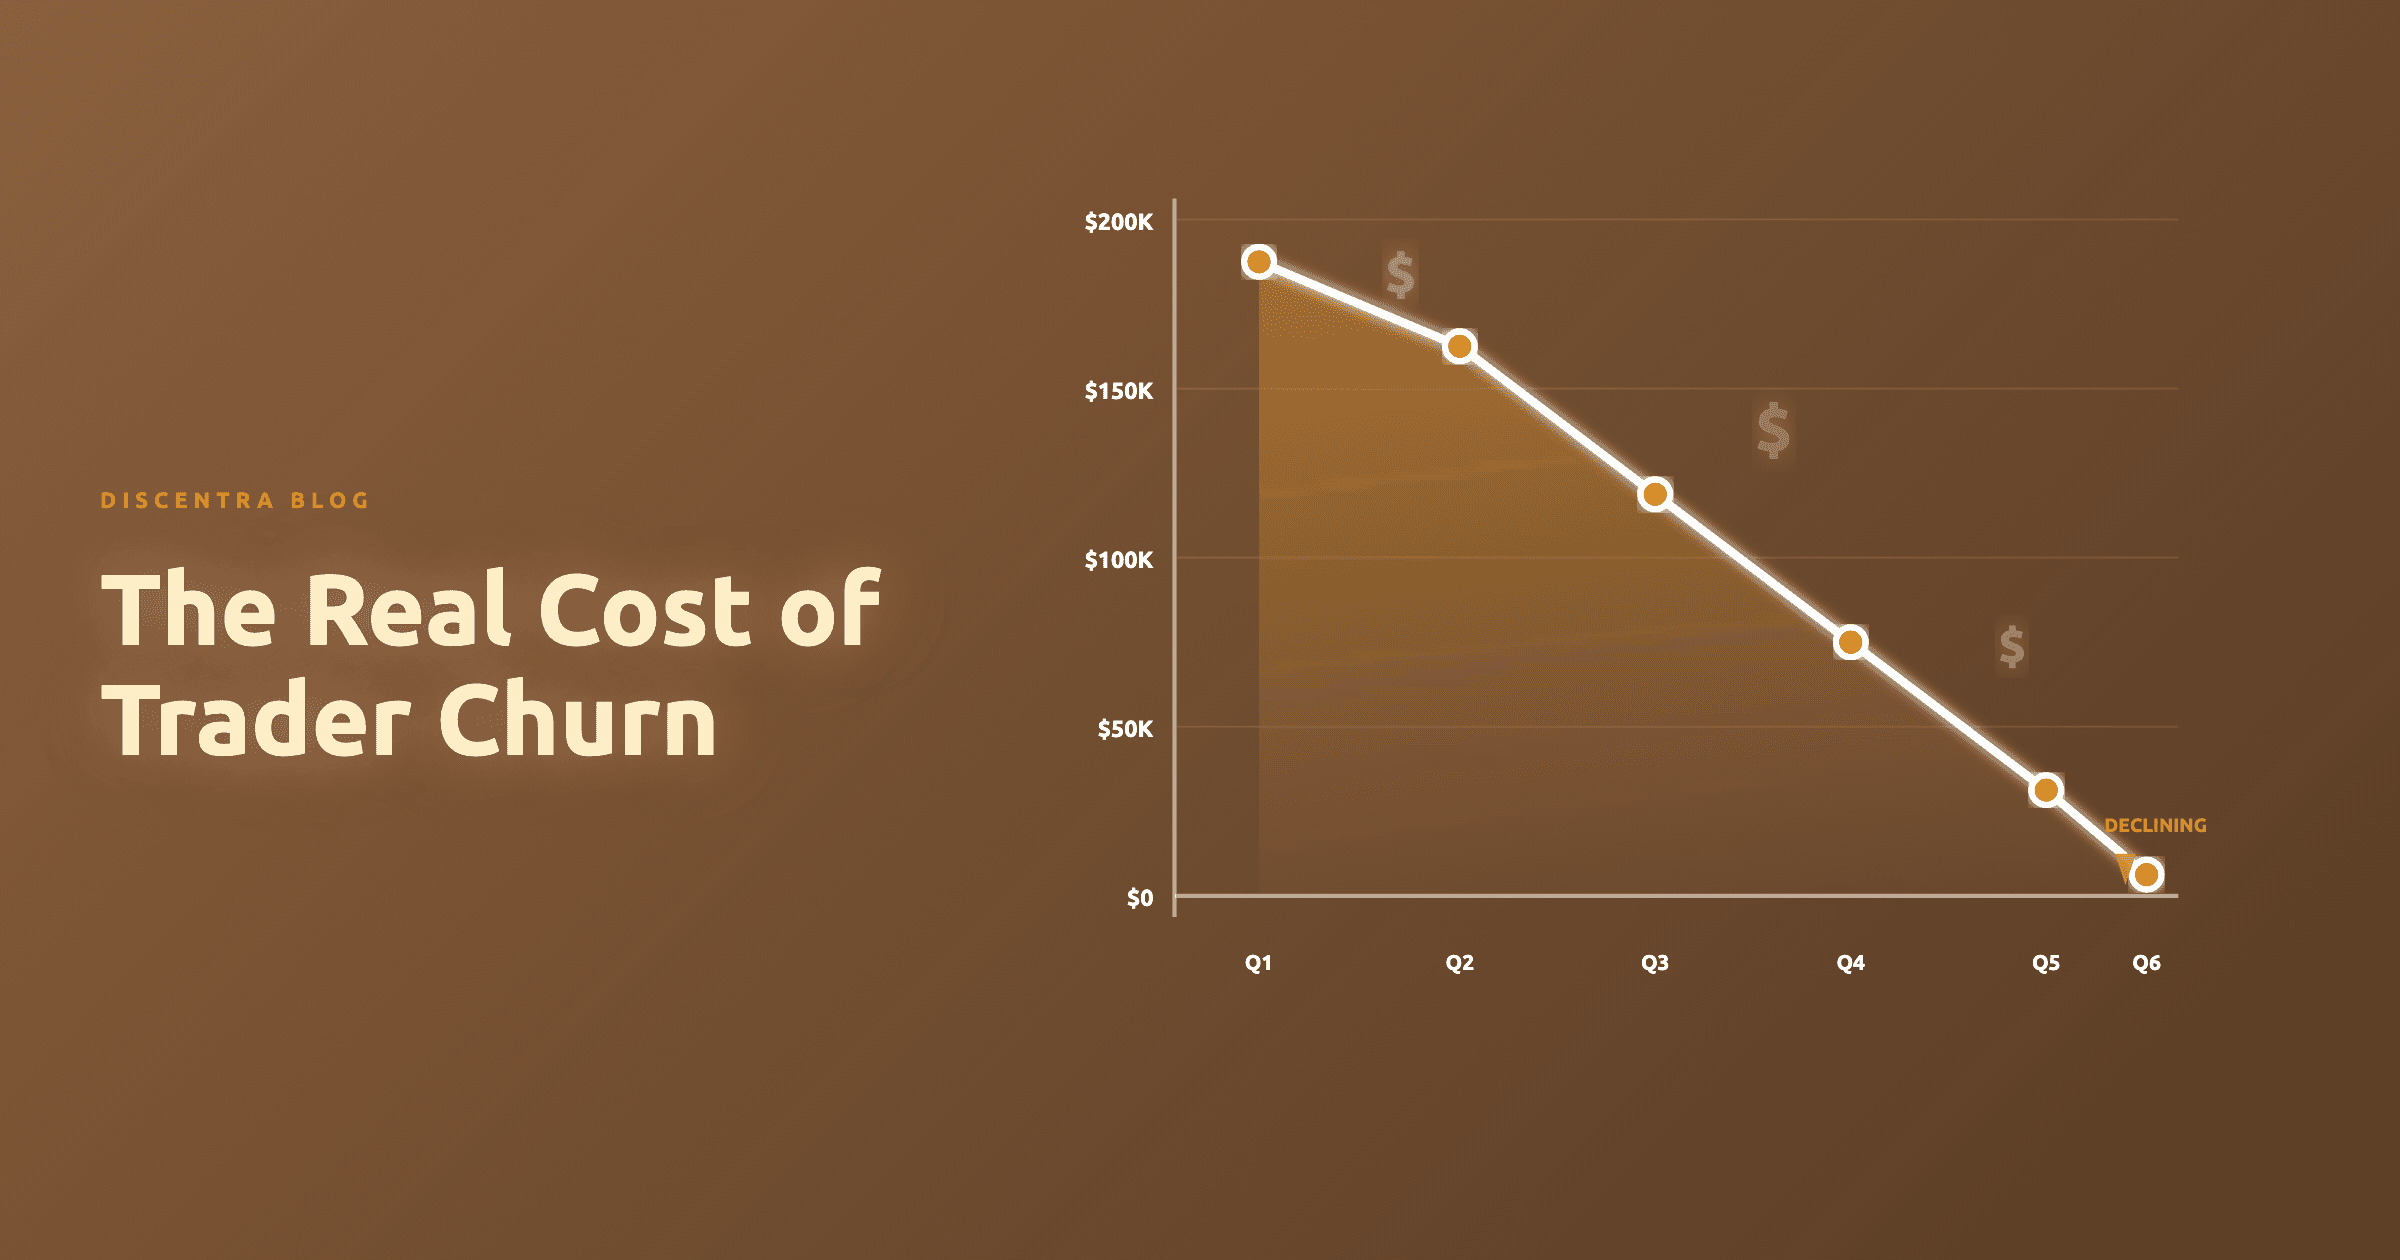
Total annual churn cost:                                $18,540,000
The review line assumes $30 per churned trader, lower than the $75 in the review illustration above.
For context: the replacement acquisition cost ($6M) is pure treadmill spending. It generates no growth. It maintains the current trader count and nothing more. Every dollar of growth spending sits on top of that baseline.
The lost LTV ($11.4M) is the largest single component. No invoice records it. No alert flags it. The firm modelled, forecasted, and expected that revenue, but never collected it.
Why the timing matters
A widely repeated working number, not a regulator-published one, says ~75% of retail traders quit within their first 90 days. If your own cohort data shows that shape, your churn is concentrated early.
This concentration matters for two reasons.
The intervention window is narrow. If most of your churn falls in the first 90 days, retention efforts that start at month six arrive after most leavers have gone: the time to act is weeks, not months. Our modelling assumption, with no published source, is that a trader who makes it past 90 days is worth about four times the lifetime value of one who does not. On our working assumptions, a trader who stays past month two keeps most of a year's lifetime value on the books: $950 in the worked example.
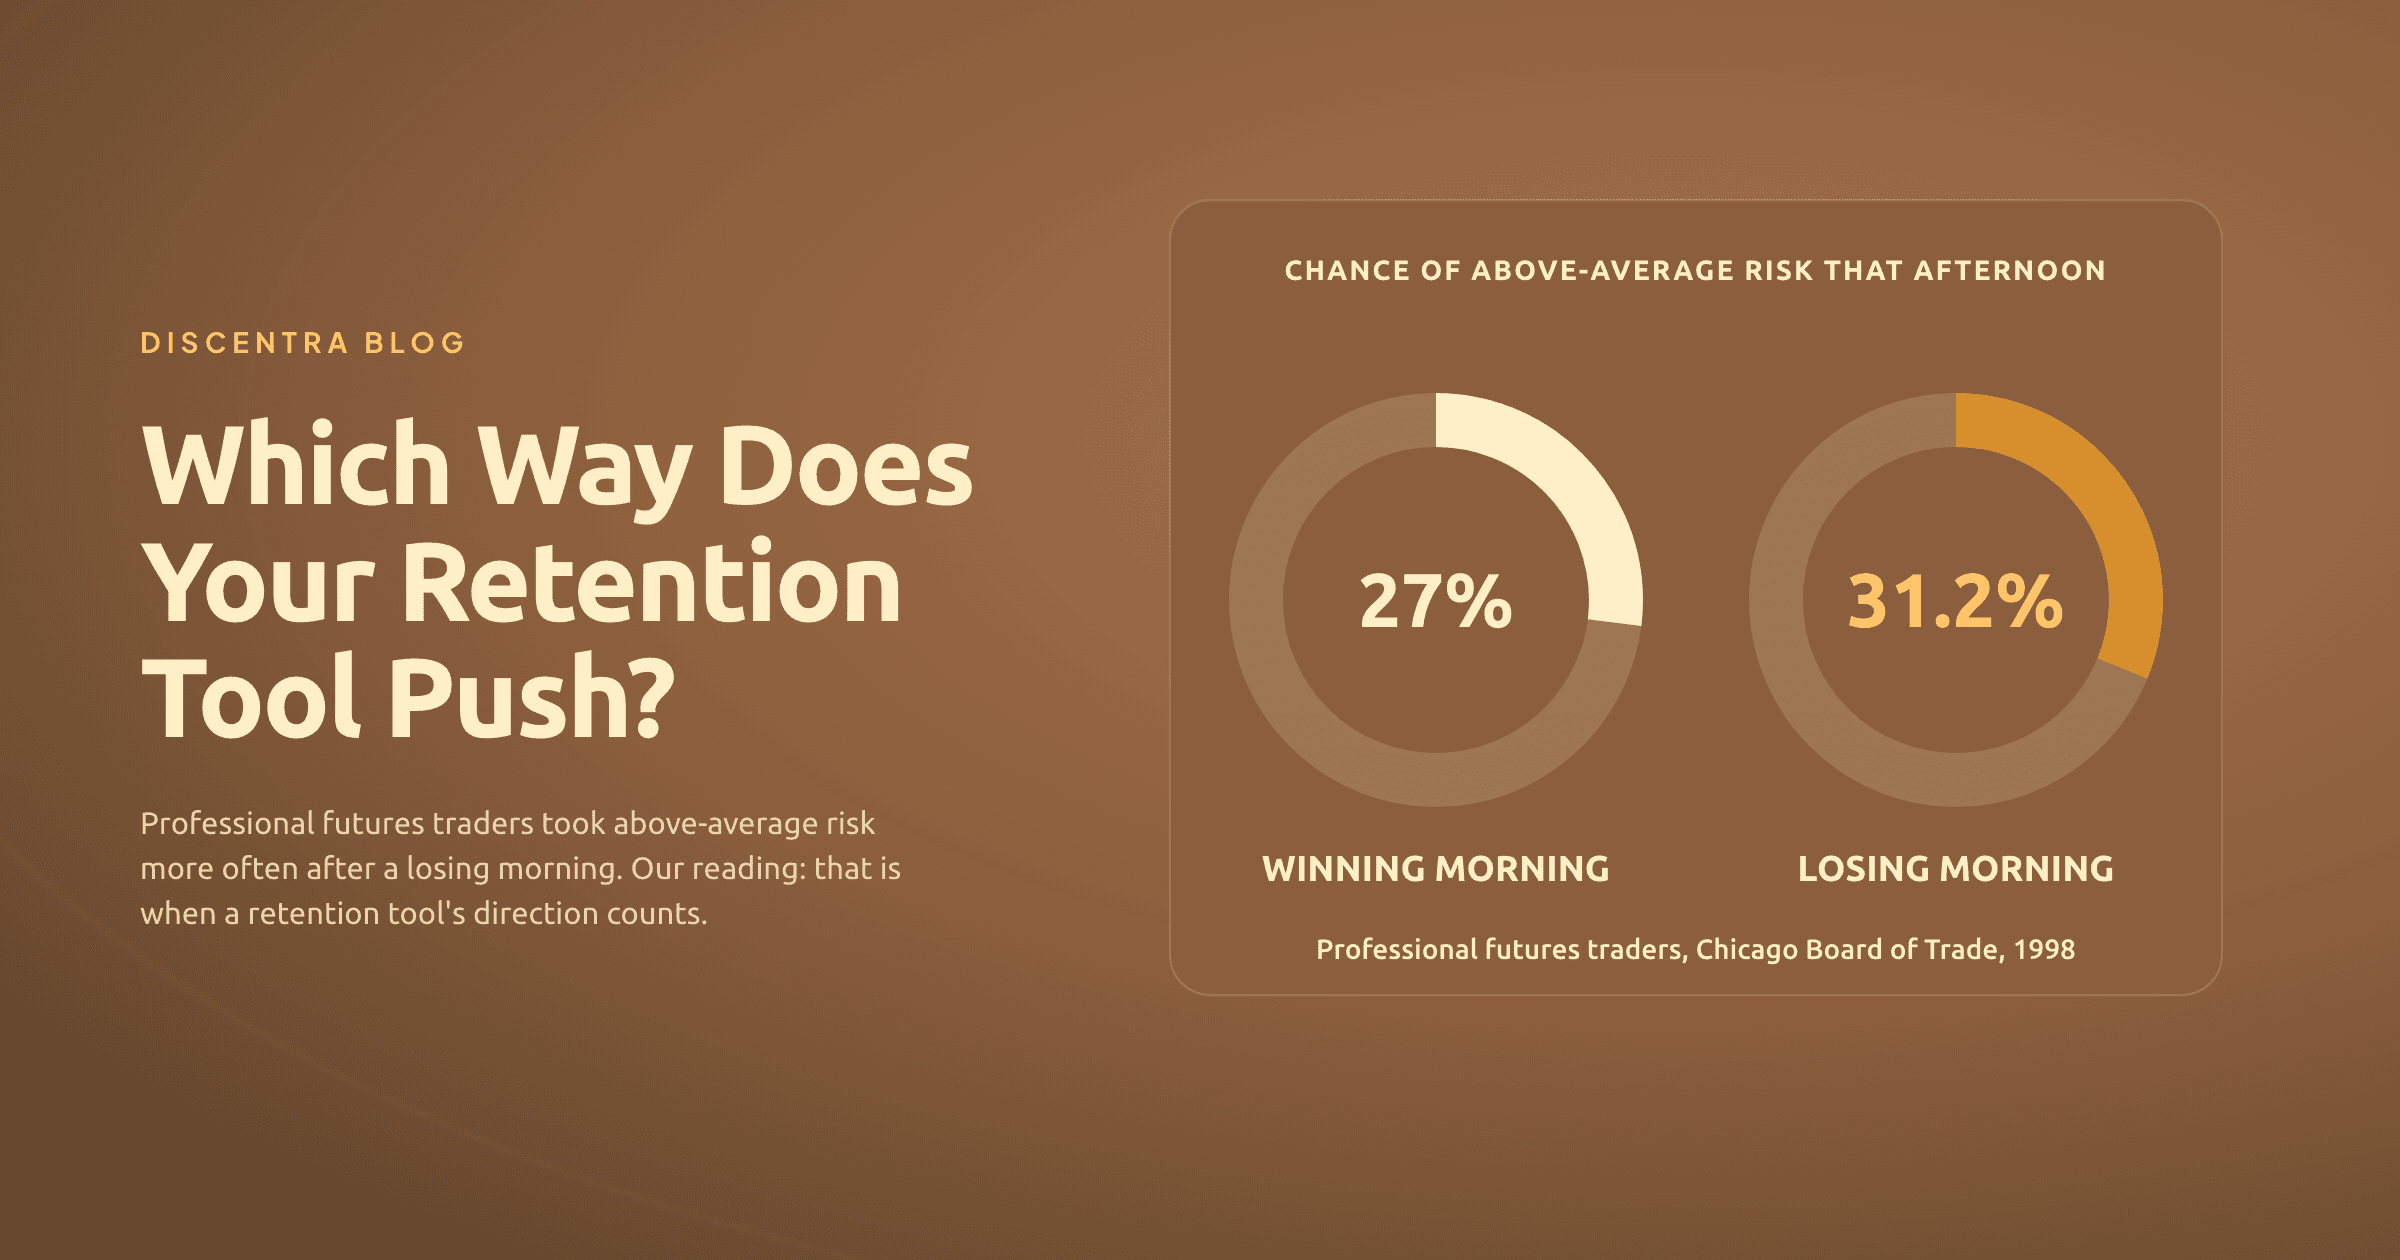
Some of the triggers are behavioural. A slow platform or wide spreads lose some traders. Others may quit because they tilt after a losing streak, revenge-trade into a bigger loss, or overlever on a position that wipes their account. We read these as psychological events with a recognisable shape: a loss, an emotional reaction, an impulsive trade, a larger loss, an exit. A firm can look for that sequence in its own trade data.
Two studies at Cambridge looked at stress hormones and financial risk. Coates and Herbert sampled cortisol from London floor traders during real working conditions.
A trader's cortisol rises with both the variance of his trading results and the volatility of the market.
A follow-up study by Kandasamy and colleagues at Cambridge raised cortisol levels in volunteers to the same range observed in those traders.
Participants became more risk-averse.
Cambridge dosed volunteers, not traders, with hydrocortisone over eight days, at cortisol levels measured in working traders, and the volunteers became more risk-averse. That is a slow, multi-day mechanism, not the one that fires minutes after a loss: a single acute dose produced no such effect. What the study shows is narrower: cortisol kept raised for days changed how these volunteers priced risk.
The window we design for is much shorter: about 4 minutes between a trigger event and the next trade. That figure is our own operational construct, not a measured one.
What firms try (and why it does not stick)
In our view, the four retention plays below aim at the wrong layer of the problem.
Better marketing
Improved acquisition funnels bring in more traders. They do nothing for the traders who are already inside the funnel and heading for the exit. Better marketing at 10% churn just means filling a larger bucket with the same hole in the bottom.
Lower prices
Reduced challenge fees or evaluation costs can attract price-sensitive traders, who are as easy to lose to the next discount as they were to win. A firm can check in its own cohorts whether discount-led sign-ups churn faster.
More support staff
Hiring additional account managers is a valid approach at small scale. At an assumed 200 traders per account manager, 10,000 traders need 50, and at an assumed $60,000 to $80,000 loaded cost each, that is $3M to $4M a year. They are still reactive: they respond after the trader has decided to leave, not in the minutes after a trigger.
Trading education
Webinars, courses, and strategy guides help traders learn. They are consumed before or after trading sessions. They are not present at 2pm on a Tuesday when a trader has just taken three consecutive losses in 12 minutes and is about to enter a revenge trade at 3x their normal size. Education is retrospective. The problem is real-time.
Behavioural intervention: a different approach
The idea is an external prompt to pause and reassess, timed for the moments when emotion can cloud someone's decisions and training done in advance is all they would otherwise have.
Applied to trading: detect behavioural triggers (rapid-fire trades, position size spikes, immediate re-entries after losses) and intervene within that 4-minute window before the next trade executes. We know of no study that has tested whether such a prompt changes what traders do next, so treat this as reasoning, not a result.
The intervention is coaching, not financial advice. No trade recommendations. No price predictions. No "buy this" or "sell that." A voice says: "You have taken three losses in 10 minutes and your position size doubled. What does your trading plan say about this situation?"
The technology to deliver this (real-time data processing, a voice call built to ring within 5 seconds of a trigger, and conversational AI set up to coach without advising) has, in our assessment, become practical as voice AI costs have fallen and latency has improved.
The economics follow, as an illustration rather than a forecast. If a behavioural intervention programme reduced churn by 5 percentage points (from 10% to 5% monthly), the churn cost in our worked example would fall by over $9 million a year.
The firms that will win
By our own count, over 250 prop firms compete, many of them on similar rules, fee structures and platforms. Brokers compete on spreads measured in tenths of a pip. The product is commoditised.
Retention, in our view, is the advantage left to compete on. A firm that cuts churn keeps more experienced traders, and its own data will show whether referrals, support costs and its Trustpilot score move with them.
In the illustration above, the cost of inaction is over $18 million a year, growing as the trader base grows. (Why public reviews cannot tell you how much of it is behavioural: what prop firm reviews show, and what they can't.)
Our bet: the firms that win in the next five years will be the ones that stop accepting churn as normal and treat its behavioural side as a psychology problem with a coaching solution.
Sources
- Coates, J. M. and Herbert, J. (2008). Endogenous steroids and financial risk taking on a London trading floor. Proceedings of the National Academy of Sciences, 105(16), 6167-6172. pnas.org/doi/abs/10.1073/pnas.0704025105
- Kandasamy, N., Hardy, B., Page, L., Schaffner, M., Graggaber, J., Powlson, A. S., Fletcher, P. C., Gurnell, M. and Coates, J. (2014). Cortisol shifts financial risk preferences. Proceedings of the National Academy of Sciences, 111(9), 3608-3613. pnas.org/doi/10.1073/pnas.1317908111
- ESMA (2018). ESMA agrees to prohibit binary options and restrict CFDs to protect retail investors. Press release, 27 March 2018. esma.europa.eu
- Reichheld, F. F. and Sasser, W. E. (1990). Zero Defections: Quality Comes to Services. Harvard Business Review, September-October 1990. hbr.org/1990/09/zero-defections-quality-comes-to-services